As opposed to leading indicators which generate early trade signals, momentum or lagging indicators give confirmation signals when the trend has already found directional momentum. Because of that, lagging indicators are also known as trend-following indicators.
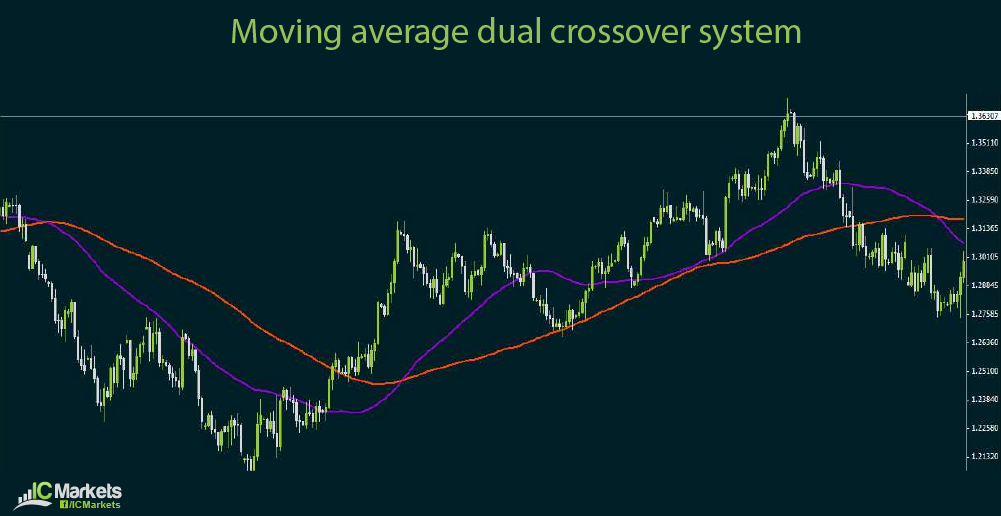
One of the most basic examples of lagging indicators is the moving average crossover system. This can employ either simple or exponential moving averages with different parameters in combination to come up with buy or sell signals. When the shorter-term moving average crosses above the longer-term moving average, it is considered a buy signal. When the shorter-term moving average crosses below the longer-term moving average, it can be a sell signal.
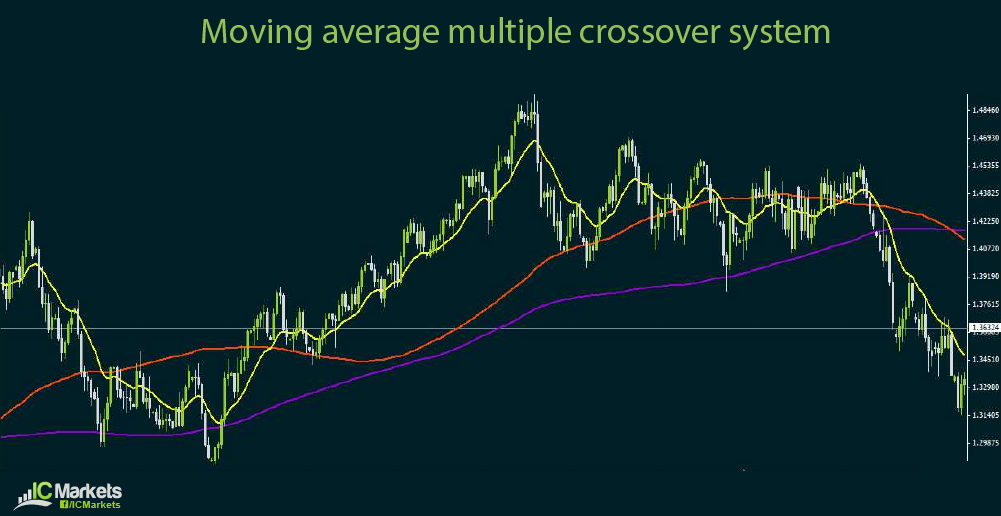
Some traders opt to use a number of moving averages in combination. Conservative rules suggest that when the moving averages are arranged in a descending manner from top to bottom, it could be a sell signal. When moving averages are arranged in an ascending manner from top to bottom, it could be a sell signal.
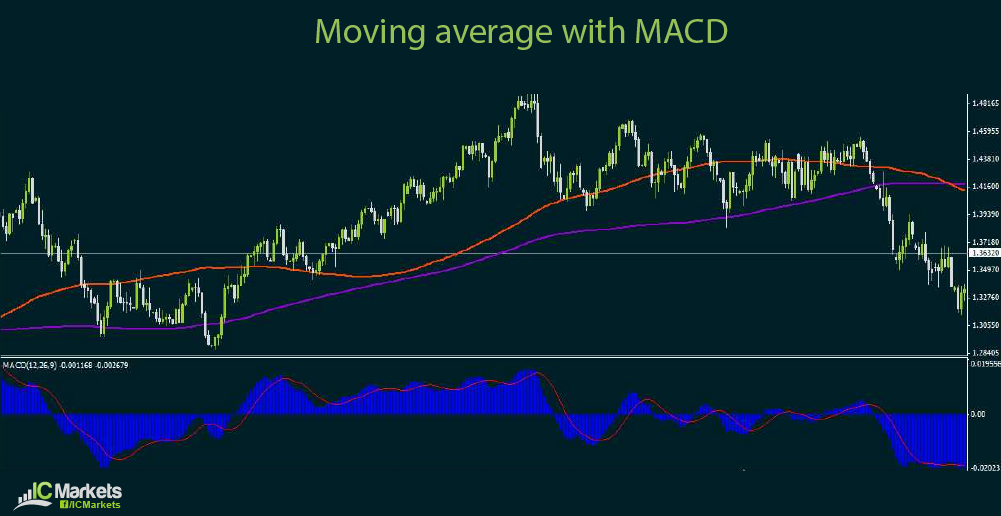
Another kind of lagging indicator is the MACD, which is short for moving average convergence divergence. As the name suggests, this method also makes use of moving averages but focuses more on the convergence or divergence of these indicators.
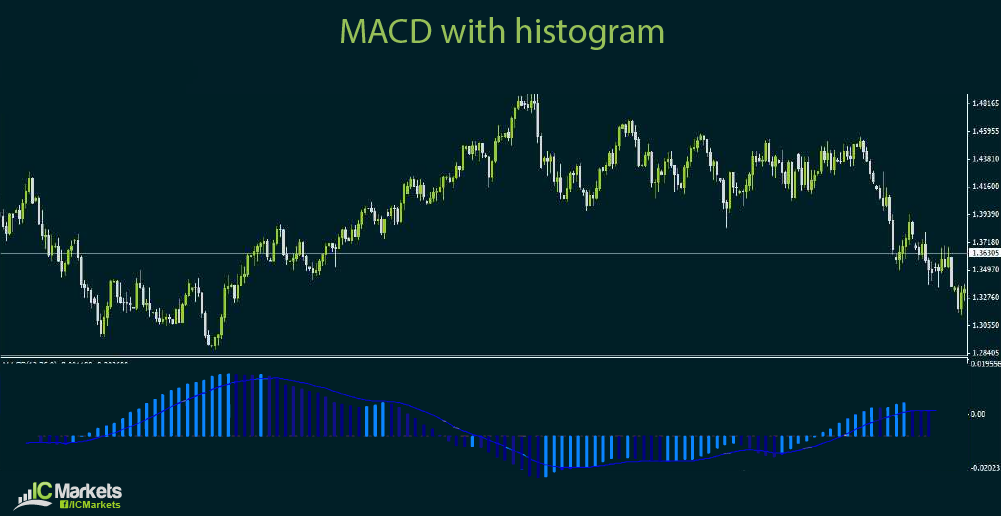
The MACD chart also includes the histogram, which keeps track of the difference between the moving average. The criss-crossing lines at the bottom, which is the actual MACD, shows the moving average of the difference between the moving averages.
As mentioned in an earlier section, it is not important to memorize how these indicators are derived but that it is more crucial to understand how to apply them. While the MACD may seem like a complicated tool at first, it pretty much functions in the same manner as moving averages.
When the MACD lines move closer to each other, this means that the actual moving averages are converging and that a market turn might be in the cards. On the other hand, when the MACD lines move apart form each other, this means that the actual moving averages are diverging and that the trend is getting stronger. In a way, MACD can also be treated as both a leading and lagging indicator.
Trading using the MACD can also make use of the crossover method. When the MACD lines cross, it indicates the start of a new trend. Waiting for a few histogram bars to grow larger can be a way of getting confirmation that the trend will be strong.
As with leading indicators, the parameters of lagging indicators can also be tweaked to suit the trader’s style and preferences. Generally speaking, shorter periods tend to result in more trade signals but with the higher chance of getting false ones. Longer periods generate fewer trade signals, which means that one might miss out on a few good trade opportunities.


