Fibonacci retracement levels, which are commonly used to specify potential entry levels during a trending market environment, comprise another group of inflection points. These retracement levels were based the work of Leonardo Fibonacci, who is a famous mathematician known for his discovery of the golden ratio.
According to Fibonacci, this ratio describes the natural proportion of various things, from the spirals of a seashell to the high-probability forex trend retracements. When it comes to trading, the important Fibonacci retracement levels to note are the 0.236, 0.382, 0.500, and 0.618 ratios.
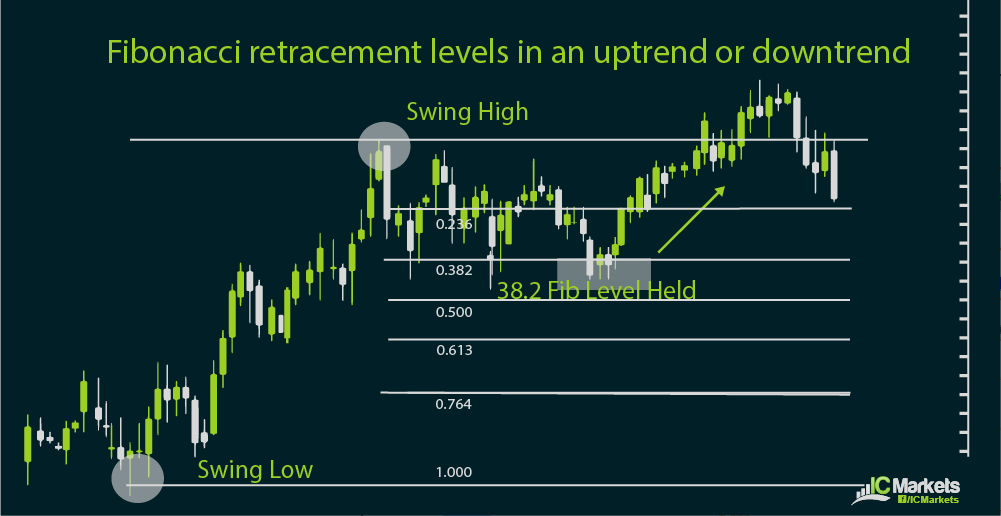
There is no need to memorize these figures as most forex trading platforms or charting software already include the Fibonacci retracement tool. All you need to do is to connect the latest swing low to swing high in an uptrend or the latest swing high to swing low in a downtrend, and the Fibonacci retracement levels will automatically be generated.
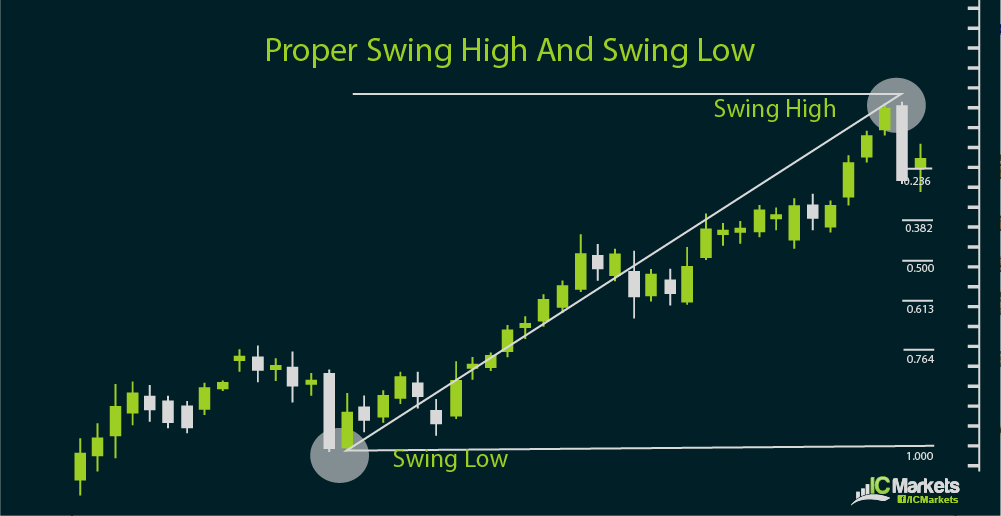
What’s important to note when using this tool is how to connect the proper swing highs and lows. A good rule of thumb to determine a swing high is to look at the highest point of the trend with the previous two candles closing below it and the next two candles also closing below it. For the swing low, this is the lowest point of the trend with the previous two candles closing above it and the next two candles also closing above it.
Another rule of thumb is to go from left to right. In an uptrend, you should be going from the swing low to the swing high in later price action. For a downtrend, you should be connecting the swing high to the swing low in later price action.
Now, once the Fibonacci retracement levels are generated, how do you decide where to set your entry orders? One way to go about it would be to pick the level that lines up with the most inflection points, such as the pivot points or psychological levels.
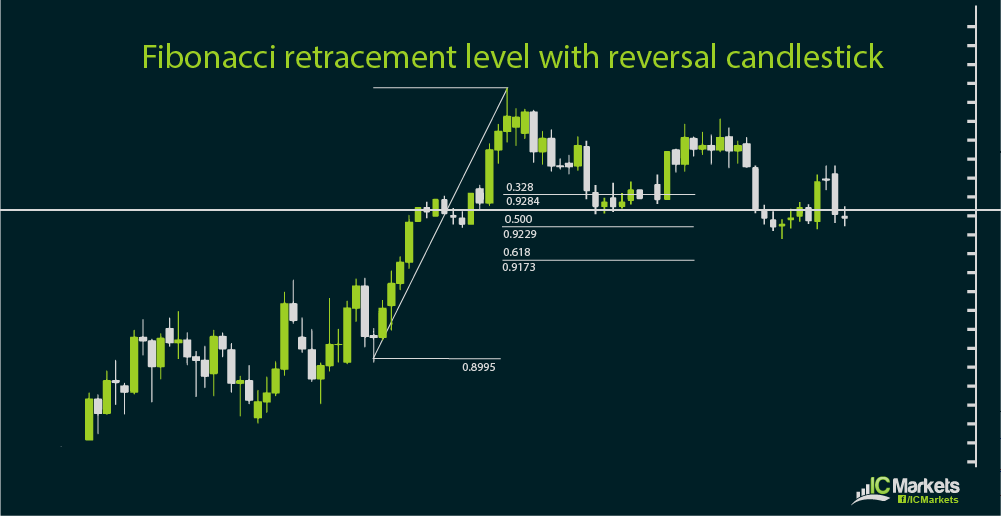
Another way would be to select the level that coincides with a prevailing trend line. Other traders pick their entry point when reversal candlesticks have formed and they decide to enter their trades at market.
There is no hard and fast rule to pinpoint exactly which Fibonacci level is most likely to hold as support or resistance. A good grasp of market psychology, fundamentals, and other technical factors could guide you in your technical analysis, but this kind of understanding is developed with enough practice and screen time.
As for setting profit levels, another kind of Fibonacci levels comes in handy. These are known as Fibonacci extensions and are covered in the next section.


