A note on lower timeframe confirming price action…
Waiting for lower timeframe confirmation is our main tool to confirm strength within higher timeframe zones, and has really been the key to our trading success. It takes a little time to understand the subtle nuances, however, as each trade is never the same, but once you master the rhythm so to speak, you will be saved from countless unnecessary losing trades. The following is a list of what we look for:
- A break/retest of supply or demand dependent on which way you’re trading.
- A trendline break/retest.
- Buying/selling tails/wicks – essentially we look for a cluster of very obvious spikes off of lower timeframe support and resistance levels within the higher timeframe zone.
- Candlestick patterns. We tend to stick with pin bars and engulfing bars as these have proven to be the most effective.
We search for lower timeframe confirmation between the M15 and H1 timeframes, since most of our higher-timeframe areas begin with the H4. Stops are usually placed 5-10 pips beyond confirming structures.
EUR/USD:
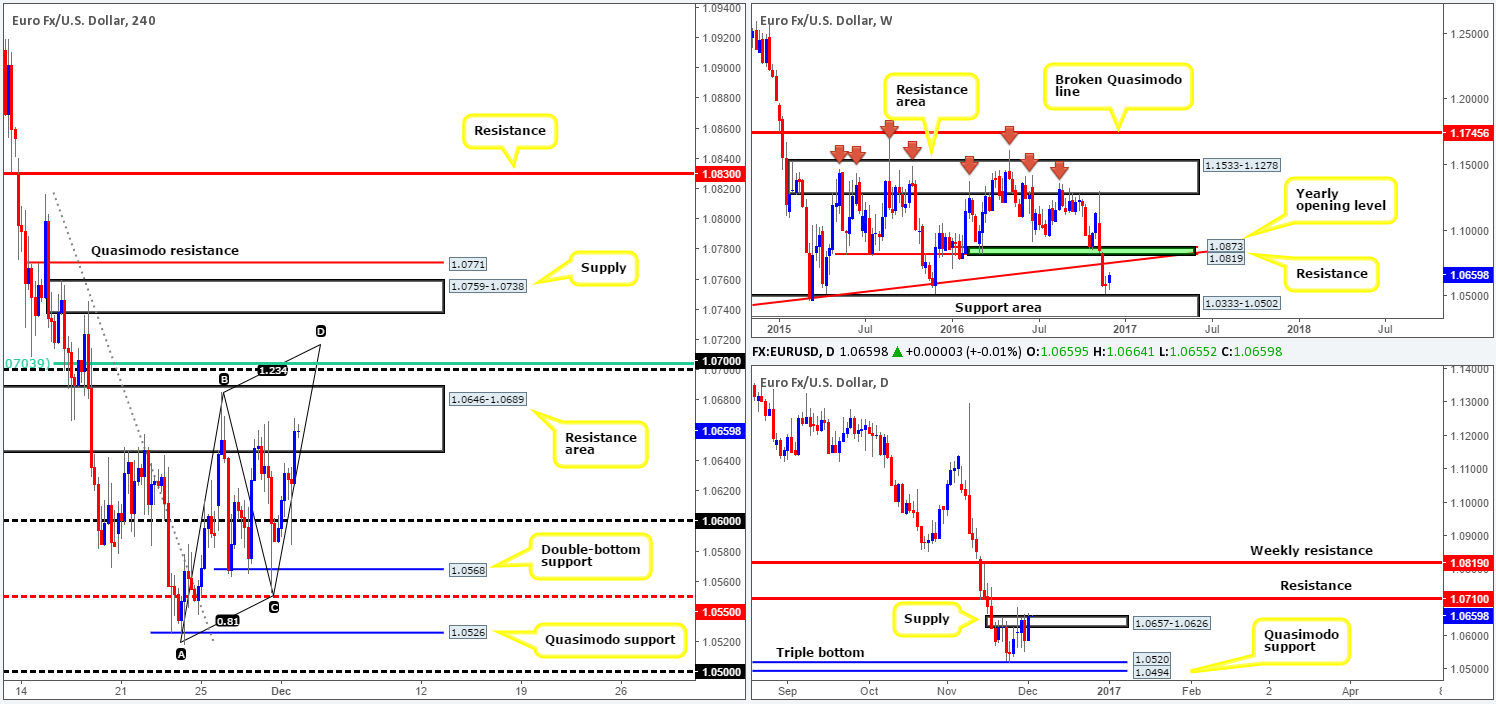
The pair, as you can see, closed above and retested 1.06 amid a generally well-bid EUR yesterday, ending the day on a slightly better footing than Wednesday. US Jobless claims came in worse than expected, and was largely ignored by the market. US ISM manufacturing, released an hour or so later, initially saw a mixed response (see M30 indecision candle), despite coming in hotter than expected.
With the buyers and sellers once again seen battling for position around a H4 resistance area at 1.0646-1.0689, our desk has eyes on the 1.07 neighborhood today. Granted, price will have to tackle the current H4 resistance area and the rather beaten-up daily supply at 1.0657-1.0626 before reaching this level, but think of all those buy stops sitting just above these zones! 1.07 also sits just 10 pips below a daily resistance at 1.0710, fuses with a nearby H4 AB=CD bearish formation at 1.0715 and a H4 61.8% Fib resistance (green line) at 1.0703.
Our suggestions: Although we believe a sell from 1.07 is technically sound, there’s two points that warrant attention:
- Technically speaking, weekly action shows room to advance north to the underside of a long-term trendline resistance extended from the low 0.8231, thus this may place pressure on a short from 1.07.
- Let’s also remain vigilant to the fact that today’s docket boasts one of the biggest, if not the biggest, economic releases of the month: The US employment report.
Therefore, we would only advise trading the 1.07 boundary 30 minutes pre/post the event, and only with the aid of a lower timeframe sell signal (see the top of this report for ideas on how to use the lower timeframe candles to confirm entry).
Data points to consider: US employment report at 1.30pm, followed by FOMC member Brainard speaks at 1.45pm GMT.
Levels to watch/live orders:
- Buys: Flat (stop loss: N/A).
- Sells: 1.07 region ([waiting for lower timeframe confirming action is preferred] stop loss: dependent on where one confirms the area).
GBP/USD:
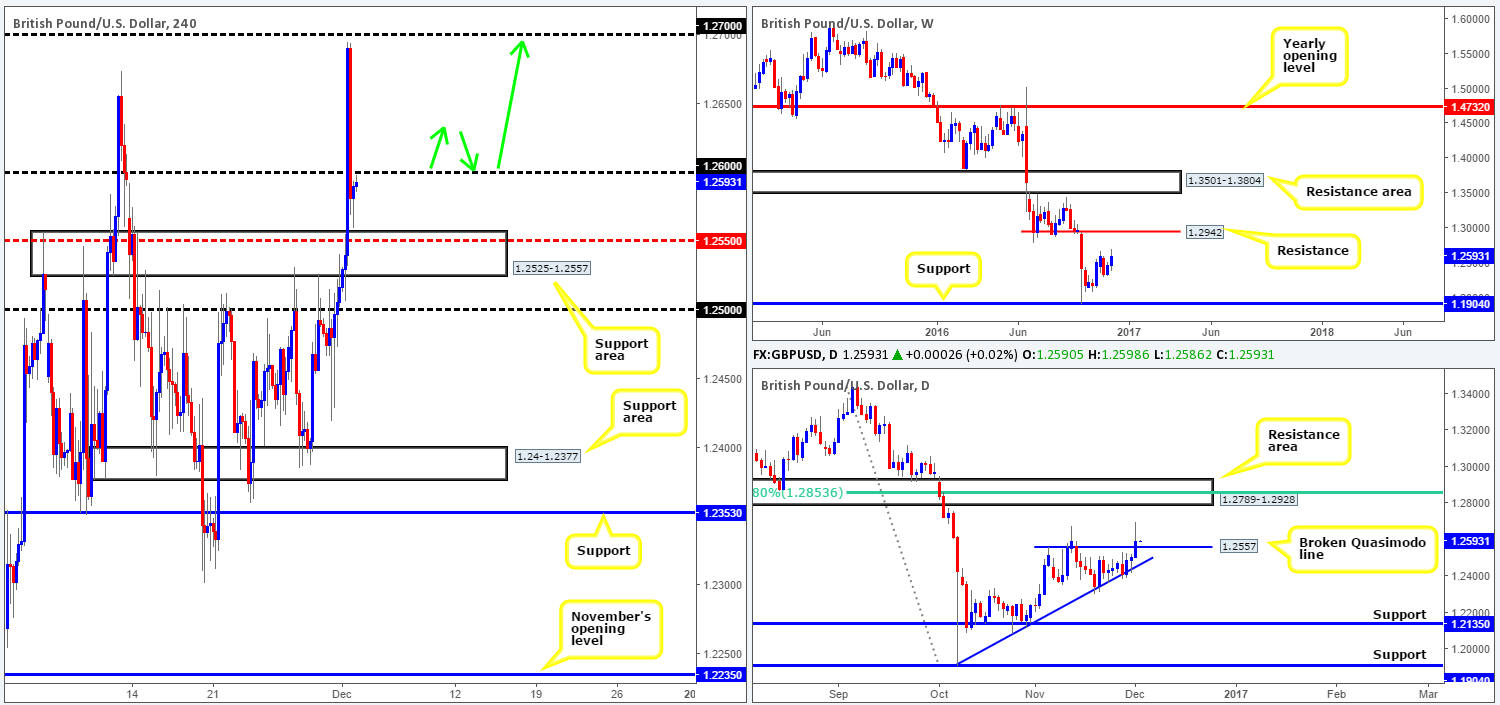
With the market essentially overlooking the UK PMI report during yesterday’s London’s morning segment, which came in worse than expected, the pound rallied to highs of 1.2695 on the day. Comments made by Brexit secretary David Davis on the possibility of making contributions to the EU in order to secure the best possible access to the single market, bolstered this move. The rally, however, was a short-lived one, as price, just as aggressively, tumbled back below the 1.26 threshold to lows of 1.2559 on the day.
Perhaps the most compelling factor here is the daily close above the daily Quasimodo resistance at 1.2557. This could, assuming that the bulls defend this line as support, encourage further buying to the daily resistance area at 1.2789-1.2928, which itself, sits just ahead of weekly resistance planted at 1.2942.
Our suggestions: To further corroborate our thinking that further buying may be on the cards, we would need to see the H4 candles close back above 1.26 today. A close higher, followed by a retest and either a H4 bull candle or a lower timeframe buy signal (see the top of the report) would, in our opinion, be enough to justify a long in this market, targeting 1.27 as an immediate take-profit zone. Be that as it may, we not only have the US employment report to look forward to today, we also have UK construction PMI data on the docket, so remain watchful guys!
Data points to consider: UK construction PMI at 9.30am. US employment report at 1.30pm, followed by FOMC member Brainard speaks at 1.45pm GMT.
Levels to watch/live orders:
- Buys: Watch for a close above 1.26 and then look to trade any retest seen thereafter ([H4 bull candle required following the retest] stop loss: ideally beyond the trigger candle).
- Sells: Flat (stop loss: N/A).
AUD/USD:
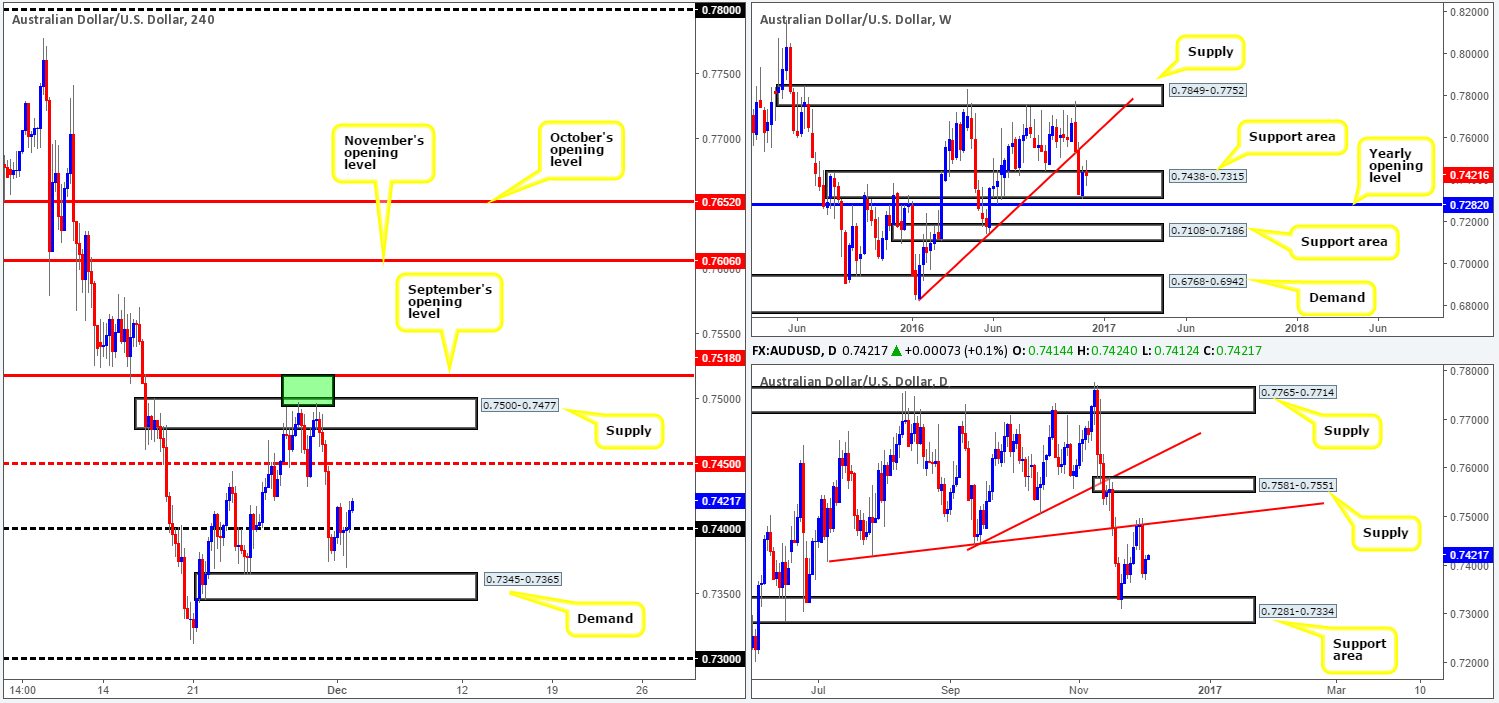
Upbeat Chinese manufacturing data boosted the Aussie’s appeal in early trading yesterday, bringing price to highs of 0.7419 going into the early hours of Europe. From here, price slightly changed tracks, revisiting the 0.74 handle and going on to put in a low of 0.7369, intensified by better-than-expected US ISM manufacturing PMI data amid the US open. As we write, however, the pair has repositioned itself back above 0.74, looking poised to attack the H4 mid-way resistance at 0.7450.
Looking at this market from a weekly perspective, the candles remain firmly fixed within a support area drawn from 0.7438-0.7315. Meanwhile, lower down the curve, daily action is now seen loitering mid-range between a trendline resistance taken from the low 0.7407 and a support area coming in at 0.7281-0.7334.
Our suggestions: A retest of 0.74 is interesting given the room seen to move north on the daily chart and the fact that weekly price is trading from a support area. Should a retest of 0.74 come to fruition today, and is reinforced by a lower-timeframe buy signal (see the top of this report), we would look to jump in long here, targeting 0.7450, followed closely by the H4 supply at 0.7500-0.7477.
Data points to consider: Aussie Retail sales at 12.30am. US employment report at 1.30pm, followed by FOMC member Brainard speaks at 1.45pm GMT.
Levels to watch/live orders:
- Buys: 0.74 region ([waiting for lower timeframe confirming action is preferred] stop loss: dependent on where one confirms the area).
- Sells: Flat (stop loss: N/A).
USD/JPY:
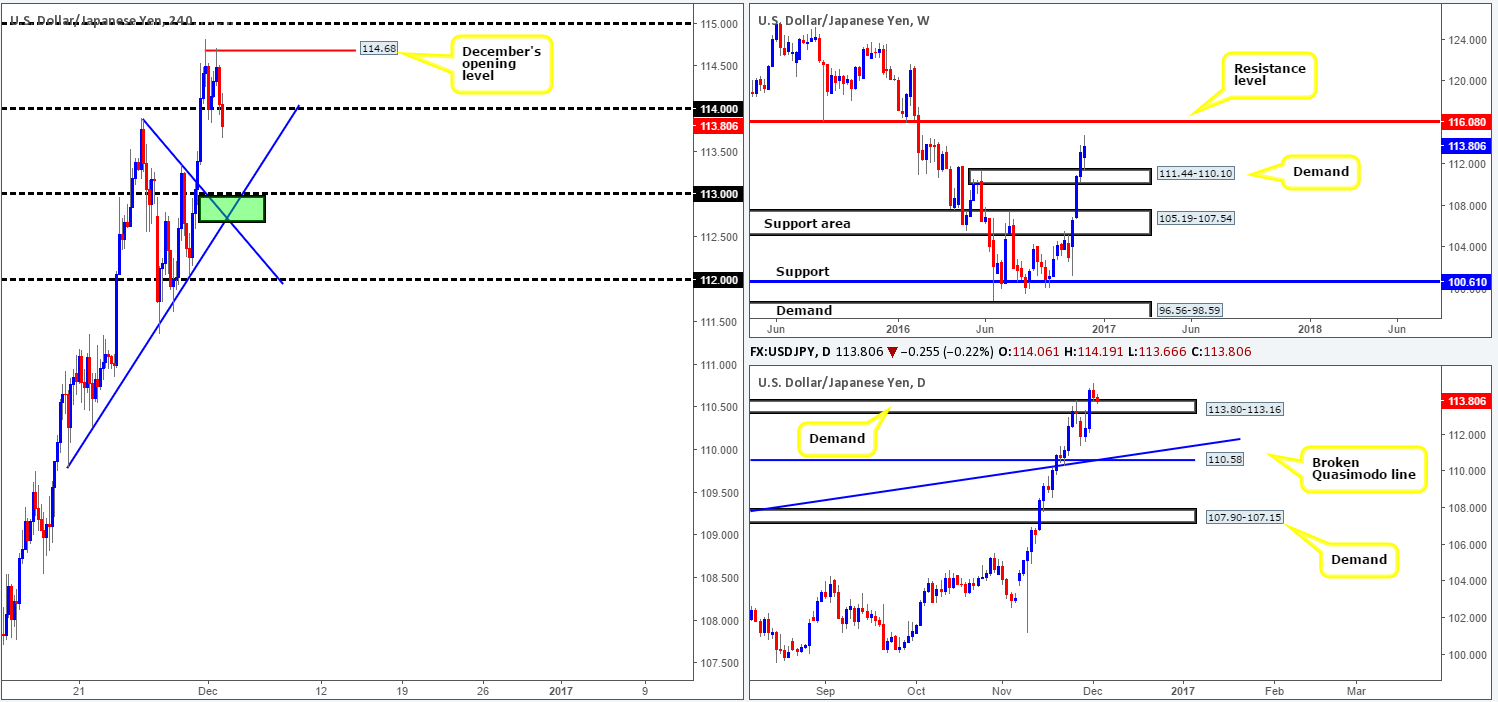
During the course of yesterday’s sessions, we saw the pair bounce from the 114 region and test December’s opening level at 114.68, before rotating lower into the US segment. In recent hours, price has, as you can see, breached the 114 handle which could lead to further selling down to 113 (bolstered by two nearby H4 trendline supports (109.80/113.87 – see green rectangle).
While the H4 candles reflect somewhat of a bearish stance at the moment, a completely different picture is currently being painted on the higher timeframes. Weekly price recently retested a supply-turned demand seen at 111.44-110.10, opening up the possibility for a move north towards the weekly resistance level penciled in at 116.08. Down on the daily chart, price is also seen retesting a recently broken supply-turned demand at 113.80-113.16. Assuming that this barrier holds ground, the next upside target, as far as we can see, is the aforementioned weekly resistance level.
Our suggestions: In view of the higher-timeframe candles, our desk has come to a consensus that passing on shorts below the 114 barrier is the better/safer route to take. In regard to longs, we would prefer to see a H4 close back above the 114 barrier, as that would likely clear the pathway north to December’s opening level, followed closely by the 115 band.
Data points to consider today: US employment report at 1.30pm, followed by FOMC member Brainard speaks at 1.45pm GMT.
Levels to watch/live orders:
- Buys: Watch for a close back above 114 and then look to trade any retest seen thereafter ([H4 bull candle required following the retest] stop loss: ideally beyond the trigger candle).
- Sells: Flat (stop loss: N/A).
USD/CAD:
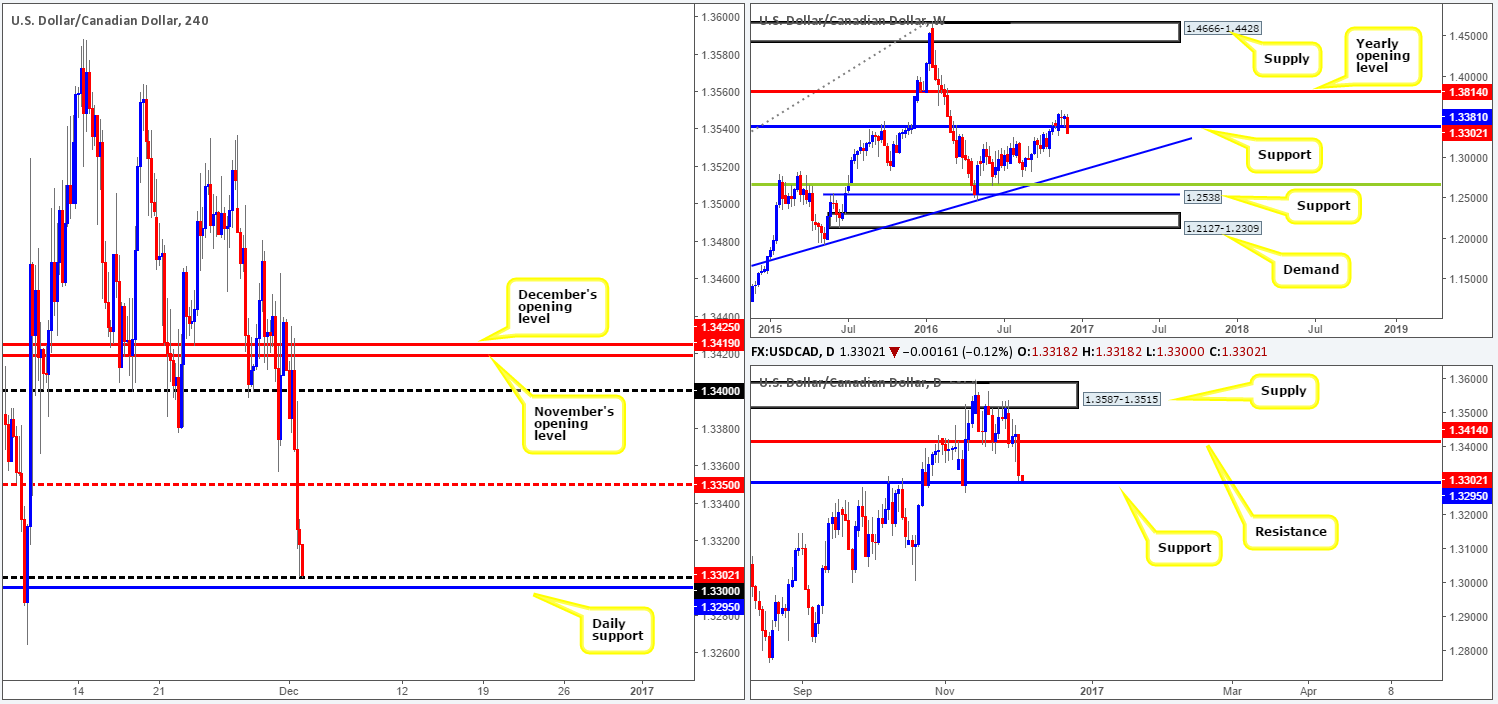
On the back of a surge seen over in the oil market, the USD/CAD took a hit to the mid-section yesterday, consequently violating the 1.34 support handle as well as the H4 mid-way support at 1.3350, before ending the day tapping the 1.33 barrier. Considering that 1.33 is reinforced by a daily support level seen just below it at 1.3295, the pair may look to correct itself from this region today. Conversely, a break through here could stimulate further selling down to the 1.32 boundary given the lack of active H4 demand seen between these two numbers (1.33/1.32). The only grumble we have about entering long from 1.33 is that fact that weekly action is now seen trading beneath its current support at 1.3381.
Our suggestions: Despite the situation on the weekly timeframe, a long from 1.33 is still viable, in our book. Though, one still needs to tread carefully here. Not only do we have a round of US and Canadian employment numbers hitting the wires later on today, psychological boundaries are typically prone to fakeouts. As a result, our desk would not stamp this a buy zone unless a reasonably sized H4 bullish candle forms. Although this does not guarantee one a winning trade, it does show buyer interest.
Data points to consider today: Canadian employment at 1.30pm. US employment report at 1.30pm, followed by FOMC member Brainard speaks at 1.45pm GMT.
Levels to watch/live orders:
- Buys: 1.33 region ([reasonably sized H4 bullish close required prior to pulling the trigger] stop loss: ideally beyond the trigger candle).
- Sells: Flat (stop loss: N/A).
USD/CHF:
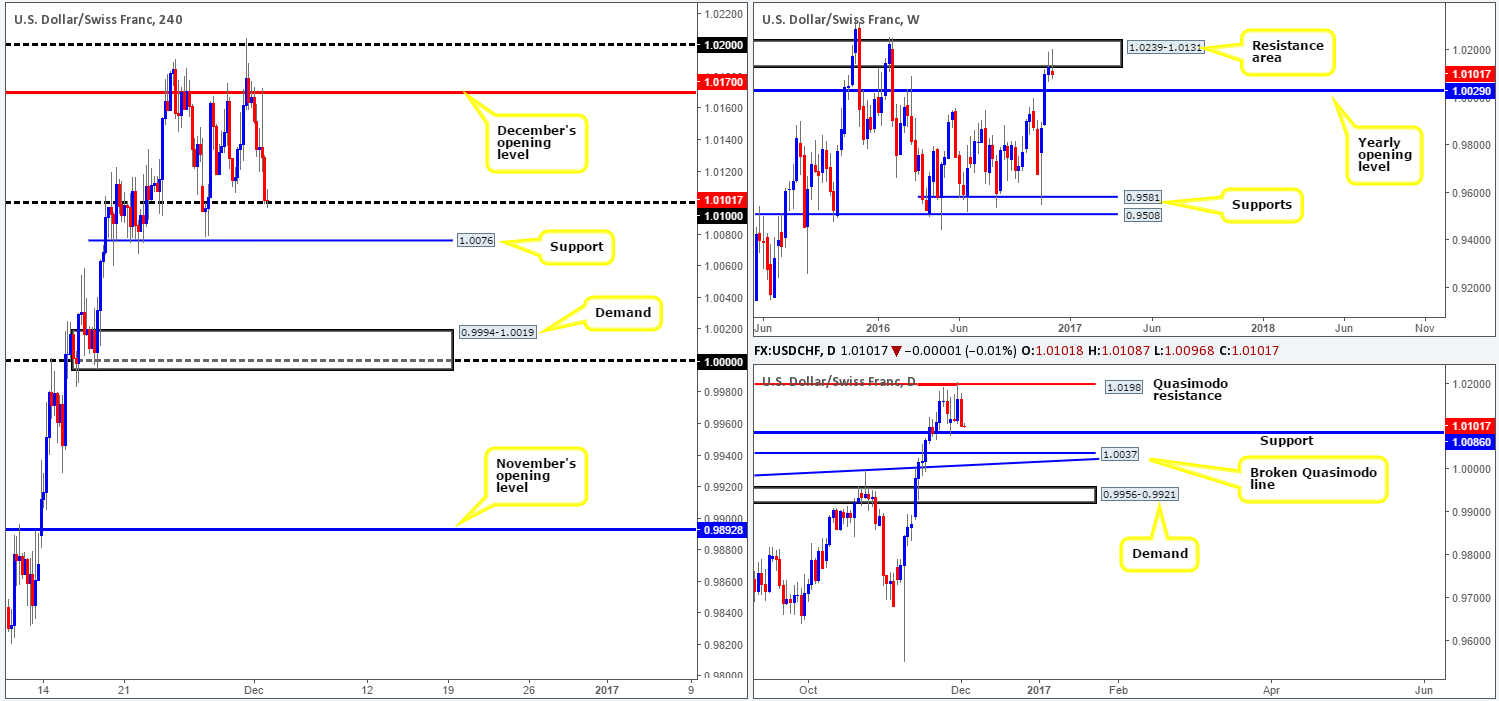
Kicking this morning’s analysis off with a look at the weekly timeframe shows that bears continue to hold the pair firm at a resistance area coming in at 1.0239-1.0131. Providing that this continues, price may look to shake hands with the 2016 yearly opening level drawn from 1.0029 in the not so distant future. Before weekly sellers can strike this barrier, nevertheless, daily support at 1.0086 will need to be consumed. A break below here opens up the trail down to 1.0037: a daily broken Quasimodo line which sits just ahead of the aforementioned yearly opening level and also intersects with a daily trendline support taken from the high 0.9956.
Stepping across to the H4 candles, the 1.01 handle is currently seen in play, following a beautiful selloff from the 1.02 region. Once again, well done to any of our readers who managed to lock in a position from 1.02 – it turned out to be a superb short!
Our suggestions: Buying from the 1.01 handle is not really something we’d get excited about, given the weekly picture and the fact that daily support sits 14 pips below 1.01 at 1.0086. To our way of seeing things, while a long could still be possible from between H4 support at 1.0076/1.01 handle, we cannot rule out the likelihood of further selling today. A H4 close beyond 1.0076 would, in our estimation, open the doors for price to challenge H4 demand at 0.9994-1.0019 (holds parity). For those considering shorts beyond 1.0076, remain vigilant to the fact that price may not reach the H4 demand since a rotation could take shape at the above noted yearly opening level coupled with the daily broken Quasimodo support at 1.0037.
Data points to consider today: US employment report at 1.30pm, followed by FOMC member Brainard speaks at 1.45pm GMT.
Levels to watch/live orders:
- Buys: 1.0076/1.01 ([waiting for a reasonably sized H4 bullish candle before pulling trigger here is preferred] stop loss: ideally beyond the trigger candle).
- Sells: Watch for a close below 1.0076 and then look to trade any retest seen thereafter ([H4 bear candle required following the retest] stop loss: ideally beyond the trigger candle).
DOW 30:
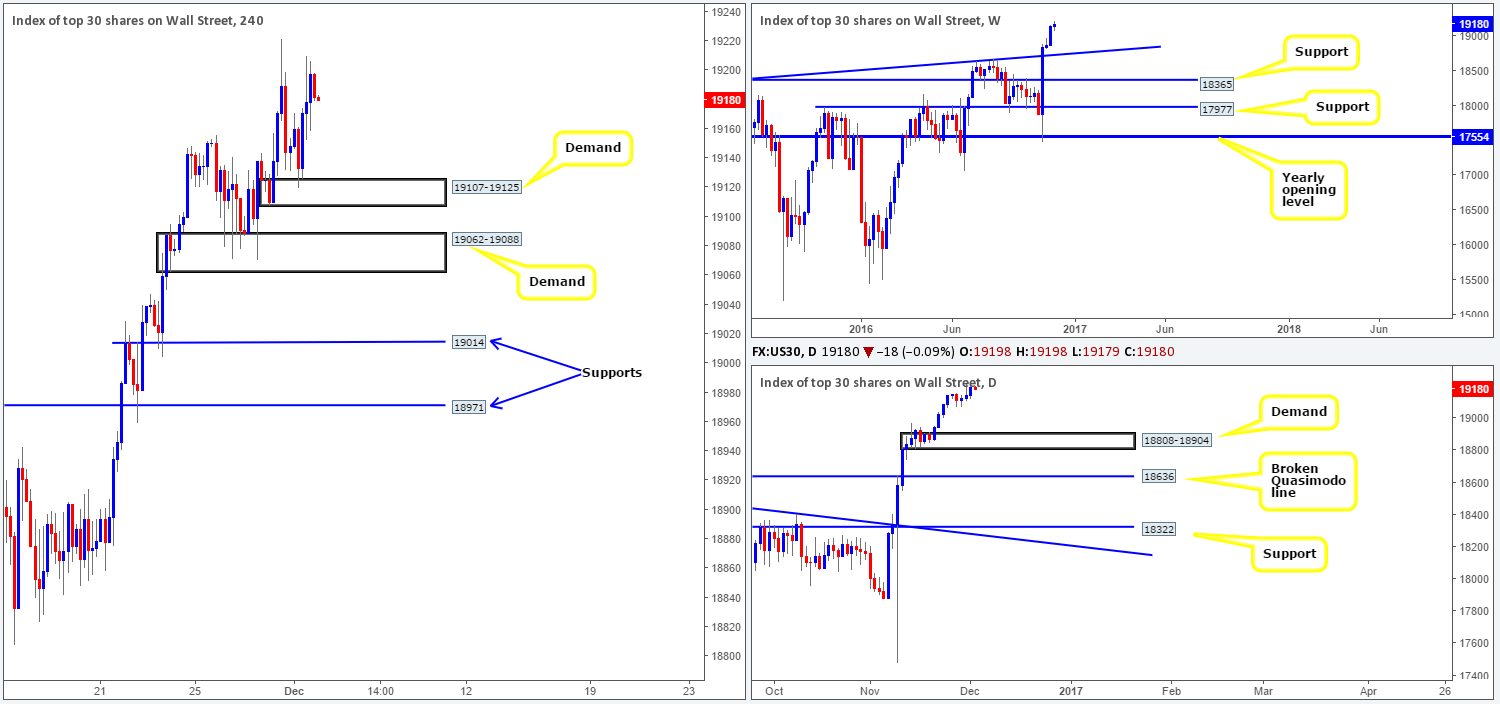
Equities closed higher yesterday after staging a relatively nice-looking rebound off the nearby H4 demand base at 19107-19125. Going forward, we feel it’s unlikely that the index will see much movement ahead of the US employment release later on today. Wednesday’s US ADP employment numbers came in better than expected, which is considered a precursor to today’s BLS report. A positive number could see stocks break to fresh highs before the week’s end, whereas a negative reading may see the current H4 demand breached due to the amount of sell stops likely positioned below here, and the H4 demand area at 19062-19088 retested.
Our suggestions: As of current price, there is very little to hang our hat on at the moment. A fresh break to new record highs, followed by a dip/retest could be something to watch out for during today’s action. Also, as we mentioned above, keep an eye on the H4 demand zone at 19062-19088 for longs, since the top area has ‘fakeout’ written all over it!
Data points to consider today: US employment report at 1.30pm, followed by FOMC member Brainard speaks at 1.45pm GMT.
Levels to watch/live orders:
- Buys: 19062-19088 ([waiting for lower timeframe confirming action is preferred – see the top of this report] stop loss: dependent on where one confirms the area).
- Sells: Flat (stop loss: N/A).
GOLD:
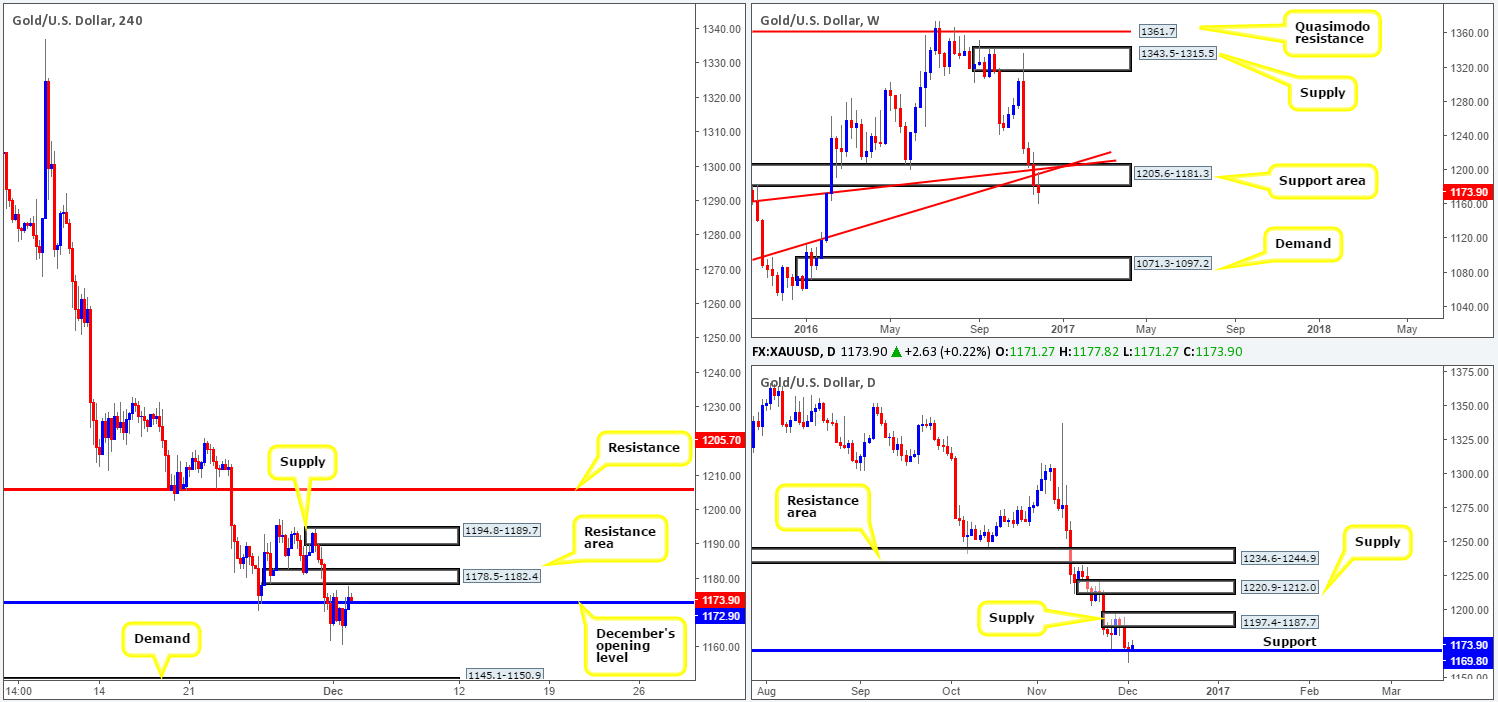
Beginning with a quick look at the weekly timeframe this morning, we can see that bullion remains offered below the support area at 1205.6-1181.3, following a retest of the two trendline resistances (1130.1/1071.2). However, before one totally discounts this weekly support area, it may be best to wait for the weekly candle to close shop. Looking down to the daily candles, it’s clear that before weekly sellers can push this market lower, daily support at 1169.8 will need to be taken out. The next upside target from this support boundary falls in at 1197.4-1187.7: a nearby supply zone.
Jumping over to the H4 candles, the team noted that the yellow metal caught a bid from around the 1160.6 region going into yesterday’s US segment. This propelled price higher, taking out December’s opening level at 1172.9, and placing the unit within a hair of the resistance area penciled in at 1178.5-1182.4.
Our suggestions: It’s a little bit of a tricky market to read this morning. On the one hand, the trend on gold is firmly pointing south, supported further by the break of a major weekly support area. On the other hand, daily support remains in form, despite yesterday’s whipsaw. However, to become buyers, the H4 resistance area at 1178.5-1182.4 would need to be engulfed, and even then, there is not much room seen to play with beyond this barrier, since there’s a H4 supply lurking directly ahead at 1194.8-1189.7 which is housed within the daily supply area mentioned above at 1197.4-1187.7.
Given the above points, and considering that today’s action is likely to be volatile due to the US employment reading, our desk has opted to remain on the sidelines today.
Levels to watch/live orders:
- Buys: Flat (stop loss: N/A).
- Sells: Flat (stop loss: N/A).
