A note on lower timeframe confirming price action…
Waiting for lower timeframe confirmation is our main tool to confirm strength within higher timeframe zones, and has really been the key to our trading success. It takes a little time to understand the subtle nuances, however, as each trade is never the same, but once you master the rhythm so to speak, you will be saved from countless unnecessary losing trades. The following is a list of what we look for:
- A break/retest of supply or demand dependent on which way you’re trading.
- A trendline break/retest.
- Buying/selling tails/wicks – essentially we look for a cluster of very obvious spikes off of lower timeframe support and resistance levels within the higher timeframe zone.
- Candlestick patterns. We tend to stick with pin bars and engulfing bars as these have proven to be the most effective.
We typically search for lower-timeframe confirmation between the M15 and H1 timeframes, since most of our higher-timeframe areas begin with the H4. Stops are usually placed 3-5 pips beyond confirming structures.
EUR/USD:
Weekly gain/loss: – 8 pips
Weekly closing price: 1.0690
Weekly opening price: 1.0721
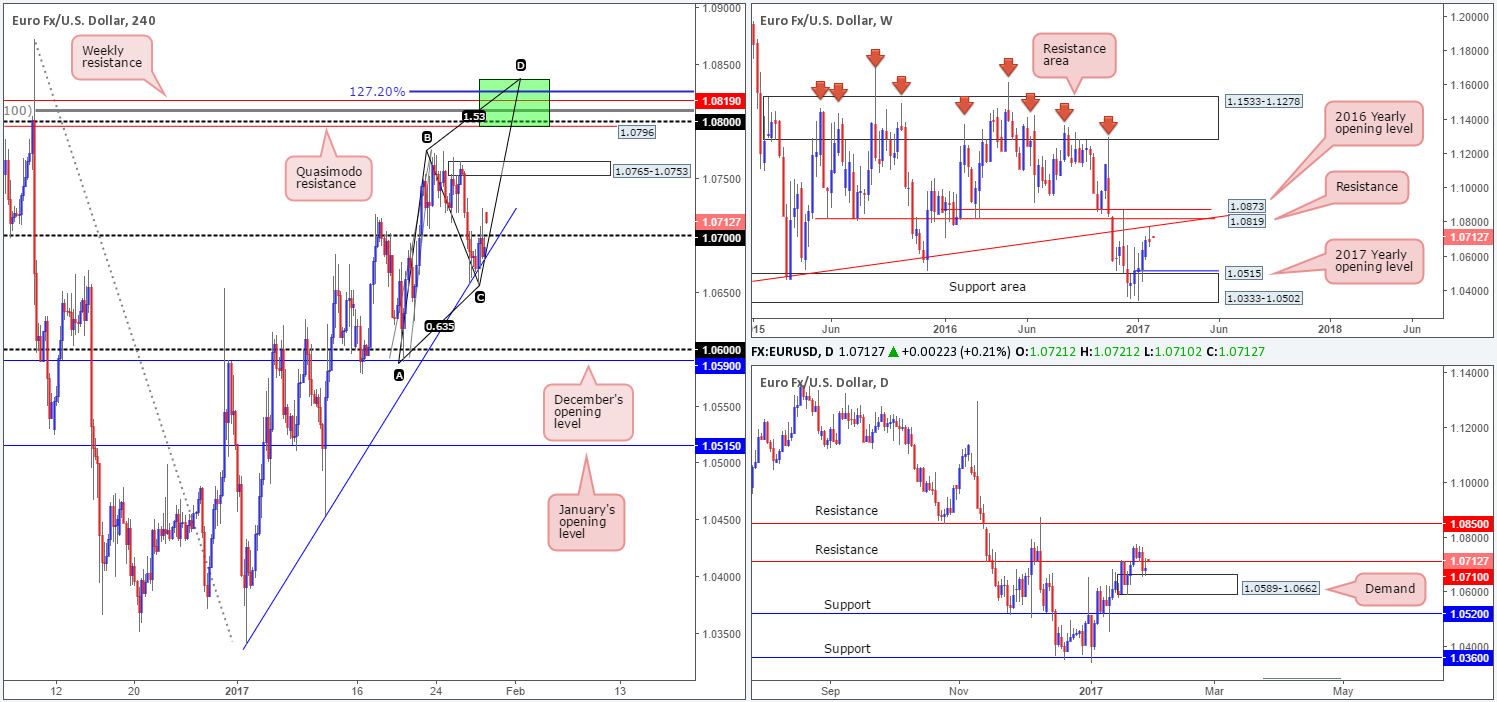
Despite the pair ranging over 100 pips last week, EUR/USD prices are little changed. What is notable from a technical perspective, nevertheless, is the reaction seen from the long-term weekly trendline resistance (stretched from the low 0.8231), which consequently formed a strong-looking weekly selling wick. Providing that the bears remain in the driving seat here, the next downside objective on the weekly timeframe comes in at 1.0333-1.0502: a weekly support area that’s positioned directly below the 2017 yearly opening level at 1.0515.
While the weekly bears look to be in a good place right now, daily demand at 1.0589-1.0662 was brought into the picture on Thursday and remained balanced going into the week’s close. Be that as it may, it will take a decisive (daily) close above the nearby daily resistance at 1.0710 before our desk reports that the bulls may be gaining the upper hand.
A quick recap of Friday’s trade on the H4 shows that the bulls attempted to breach the 1.07 handle, following a lower-than-expected US advance GDP report. However, as you can see, price failed to sustain gains beyond this point and ended the day back below 1.07.
Our suggestions: In a nutshell, the nuts and bolts of this pair’s structure can be summed up as follows:
- Weekly action suggesting lower prices ahead.
- Daily flow reacting from demand, but has yet to prove itself by closing above neighboring daily resistance at 1.0710.
Taking into account that the this morning’s open gapped over 30 pips north this morning, bringing price back above the 1.07 boundary, we’ll likely see 1.07 tested as support in the next hour as the weekend gap looks to be filled. Levels of interest above 1.07 today are the H4 supply at 1.0765-1.0753 and the H4 Quasimodo resistance at 1.0796.
One could look for an intraday bounce from the H4 supply today, but be aware that the more attractive area for sells is seen around the H4 Quasimodo. Backing this level we have the 1.08 handle, a deep H4 88.6% Fib resistance at 1.0810, weekly resistance at 1.0819 (sits just above the aforementioned weekly trendline resistance) and finally there’s also a possible H4 AB=CD bearish pattern that tops out around 1.0838 which sports a converging 127.2% Fib extension.
With the above points in mind, buying right now is something we’d feel comfortable participating in. Neither would we feel all that great above selling from the aforementioned H4 supply. We will, nevertheless, keep a close eye on the above noted 1.08 region due to its connection with the higher timeframes.
Data points to consider: German prelim CPI. US personal spending and income (PCE index) figures set for release at 1.30pm and pending home sales at 3pm GMT.
Levels to watch/live orders:
- Buys: Flat (stop loss: N/A).
- Sells: 1.08 region ([possible area to look at selling from without the need for additional confirmation] stop loss: 1.0840).
GBP/USD:
Weekly gain/loss: + 170 pips
Weekly closing price: 1.2543
Weekly opening price: 1.2581
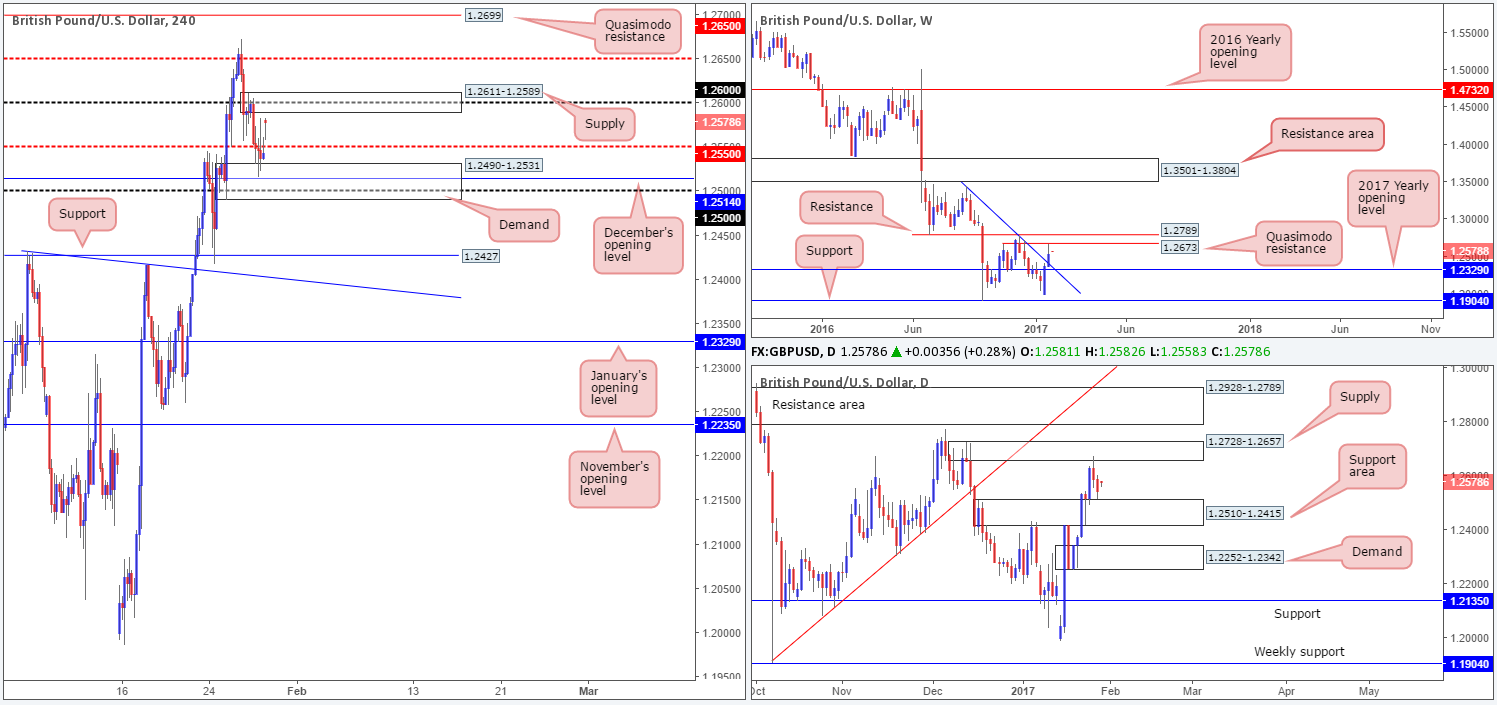
Following the prior week’s bullish engulfing candle that formed just ahead of weekly support at 1.1904, the pair drove north last week. Munching through a weekly trendline resistance (now acting support) taken from the high 1.3445, we can see that price ended the week crossing swords with a weekly Quasimodo resistance level at 1.2673, and printed a moderate end-of-week correction.
As is evident from the daily chart, daily supply at 1.2728-1.2657 bolstered last week’s correction off the weekly Quasimodo. Before we all begin searching for the sell button mind you, traders may want to note that the daily candles also closed the week a few pips ahead of a daily support area coming in at 1.2510-1.2415. A breakdown through this zone would place the daily demand base at 1.2252-1.2342 in sight, and this, as you can probably see, beautifully converges with the above noted weekly trendline support and the 2017 yearly opening level at 1.2329.
The unit, as can be seen on the H4 chart, gapped close to 40 pips north at this morning’s open, lifting price above the H4 mid-way resistance at 1.2550. This comes after a rather sluggish Friday (despite the US reporting a weak 4th quarter Advance GDP) where the candles remained capped between the above noted mid-level number and a H4 demand zone penciled in at 1.2490-1.2531.
Our suggestions: As of this moment, we do not see much to hang our hat on. H4 supply at 1.2611-1.2589, which encapsulates the 1.26 handle, may be something to pay attention to given where the weekly flow is currently positioned (see above). However, trading here without waiting for further confirmation is risky (see the top of this report for ideas on how to confirm an area using price action), since price will likely want to tag the H4 mid-way resistance point at 1.2650 due to the daily supply mentioned above at 1.2728-1.2657.
The better area, in our view, comes in at 1.2699: a H4 Quasimodo resistance that fuses beautifully with the 1.27 handle and is housed within the said daily supply as well as sitting only 25 or so pips above the aforementioned weekly Quasimodo resistance.
Data points to consider: US personal spending and income (PCE index) figures set for release at 1.30pm and pending home sales at 3pm GMT.
Levels to watch/live orders:
- Buys: Flat (stop loss: N/A).
- Sells: 1.2611-1.2589 ([wait for a lower-timeframe confirming setup to form before looking to execute a trade] stop loss: dependent on where one confirms this area). 1.27 region ([possible area to look at selling from without the need for additional confirmation] stop loss: 1.2730 – 2 pips above daily supply).
AUD/USD:
Weekly gain/loss: – 8 pips
Weekly closing price: 0.7543
Weekly opening price: 0.7558
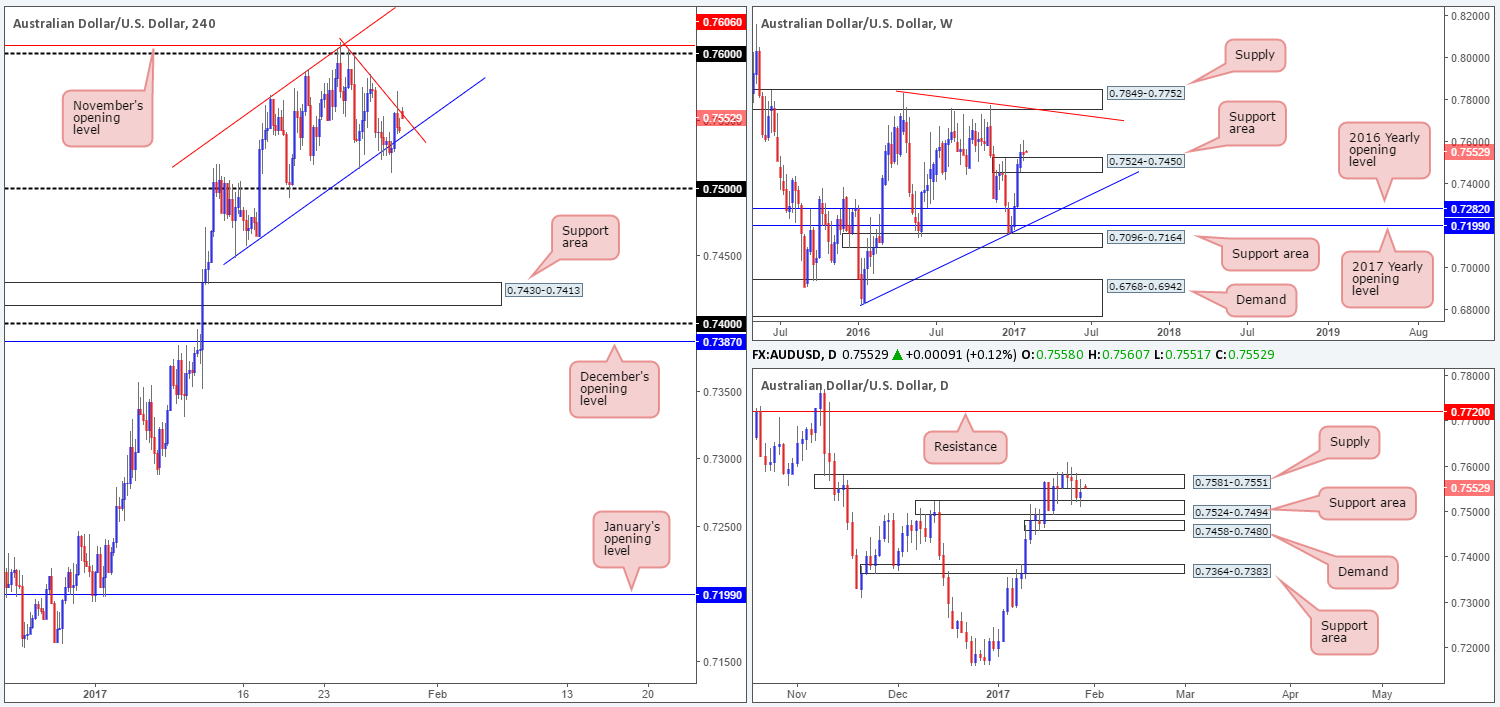
After witnessing four uninterrupted weekly bullish candles take shape, the commodity currency finished last week marginally in the red. While this may be true, the weekly support area at 0.7524-0.7450 is very much in play and could effectively force the unit higher this week. The next notable zone to the upside falls in at 0.7849-0.7752: a weekly supply area that merges with a weekly trendline resistance coming in from the high 0.7835. On a side note, zooming out one can also see a possible large-scale weekly bearish pennant forming between two converging weekly trendlines (0.6827/0.7835).
Strengthening the aforementioned weekly support area is a daily support area drawn in at 0.7524-0.7494 that held firm from Wednesday onwards last week. From this, we agree that the pendulum does indeed look to be swinging toward a rally higher. We would, nonetheless, prefer to see the nearby daily supply zone at 0.7581-0.7551 engulfed beforehand. The next area of importance beyond here sits at 0.7720, conveniently located 30 or so pips below the above mentioned weekly supply area.
Buoyed by Friday’s disappointing 4th quarter Advance GDP print from the US, the H4 candles managed to recover relatively quickly after breaking through the H4 channel support line taken from the low 0.7449. Yet, in spite of this, the bulls failed to maintain this pressure beyond the immediate H4 trendline resistance extended from the high 0.7603.
Our suggestions: In the event that a H4 bullish close is seen above the current H4 trendline resistance, an intraday long up to the 0.76 handle and its partner level (the December open at 0.7606) could be an option. It would only be once daily price has CLOSED above daily supply at 0.7581-0.7551, would we advise looking to go long on a break above 0.76/0.7606, preferably on a confirmed retest as support (see the top of this report for info on confirmation).
Data points to consider: RBA Assistant Gov. Debelle speaks at 7.45am. US personal spending and income (PCE index) figures set for release at 1.30pm and pending home sales at 3pm GMT.
Levels to watch/live orders:
- Buys: A break above/retest of the H4 trendline resistance could signal a potential long opportunity ([wait for a lower-timeframe confirming setup to form following the retest before looking to execute a trade] stop loss: dependent on where one confirms this area).
- Sells: Flat (stop loss: N/A).
USD/JPY:
Weekly gain/loss: + 50 pips
Weekly closing price: 115.06
Weekly opening price: 114.74
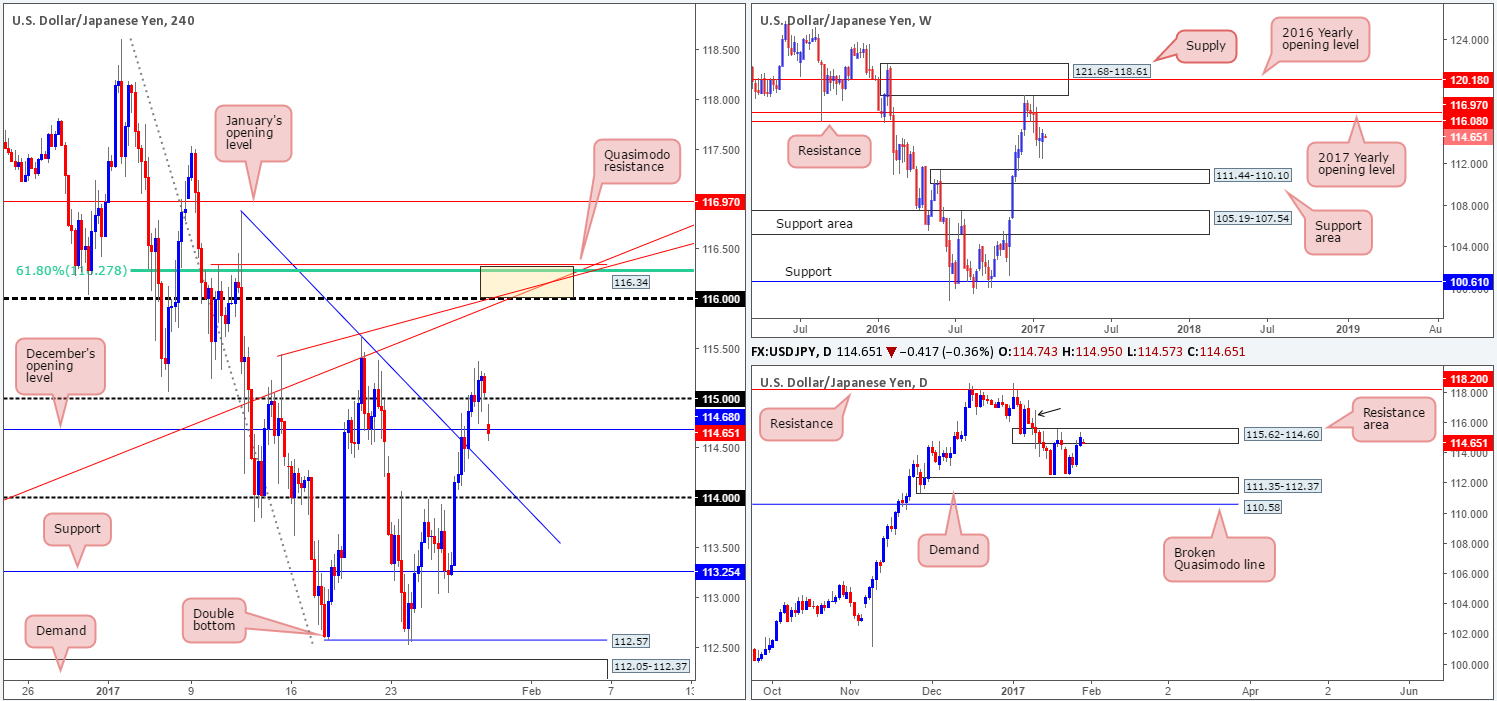
Over the last week, we can see that weekly price chalked in its second consecutive weekly bullish tail and now looks to be heading north to shake hands with weekly resistance at 116.08, followed closely by the 2017 yearly opening level at 116.97. With that being said, the weekly buyers will have to contend with daily sellers at a daily resistance area drawn in from 115.62-114.60 beforehand. Supposing that a daily close above this zone is seen, there’s little, as far as we can see on this timeframe, standing in the way of price challenging daily resistance at 118.20. The daily wick marked with a black arrow at 116.87 is, what we like to call, a supply consumption wick. It simply means that we believe this wick consumed the majority of supply above the current daily resistance area.
Weighed on heavily by Friday’s poor GDP print from the US, the USD/JPY struggled to advance from the 115 handle. The pair, however, started this week at 114.74, 32 pips lower than Friday’s closing point, resulting in price testing December’s opening level at 114.68. Attempting to go long from this monthly level would not be something we’d encourage. Not only is the 115 handle sitting a few pips above here, there’s also the fact that the daily candles remain within a daily resistance area at present (see above)!
Our suggestions: While a long from current price is discouraged, a H4 close above the 115 barrier would be attractive. This – coupled with a daily close above the daily resistance area would very likely open the trapdoor up to 116, which as we’re sure you already know, sits just 8 pips below the weekly resistance discussed above.
116 would not only make for a strong take-profit zone, but it is also a base in which shorts could be considered. Building a case for entry here we have the following: two H4 trendline resistances (115.44/112.86), a H4 61.8% Fib resistance at 116.27 and a H4 Quasimodo resistance at 116.34.
Data points to consider: US personal spending and income (PCE index) figures set for release at 1.30pm and pending home sales at 3pm GMT.
Levels to watch/live orders:
- Buys: Watch for a H4 close to be seen above the 115 threshold and then look to trade any retest seen thereafter ([wait for a lower-timeframe confirming setup to form [see the top of this report] following the retest before looking to execute a trade] stop loss: dependent on where one confirms this area).
- Sells: 116.34/116 ([possible area to look at selling from without the need for additional confirmation] stop loss: 116.36).
USD/CAD:
Weekly gain/loss: – 160 pips
Weekly closing price: 1.3148
Weekly opening price: 1.3133
Last week’s sharp run to the downside erased the bulk of the prior week’s gains, but did, however, succeed in holding firm above the weekly demand area at 1.3006-1.3115. Ahead of this angle is the 2017 yearly opening level at 1.3434 which blends with a weekly trendline resistance taken from the high 1.4689. Directly below, nonetheless, sits a weekly trendline support extended from the high 1.1278.
Bolstering the current weekly demand zone is a daily demand coming in at 1.3006-1.3041 (located around the lower edge of the above noted weekly demand) that happens to fuse with a daily trendline support taken from the low 1.2654.
On the back of Friday’s decline in crude oil prices, the USD/CAD gravitated north following a successful retest off 1.31, concluding the trading week by tapping the underside of a H4 mid-way resistance at 1.3150. Playing the long card today could be tricky given this H4 level and the nearby H4 supply at 1.3171-1.3155. There is also a H4 AB=CD approach forming (see black arrows) which does in fact terminate within the said H4 supply around the 1.3161 neighborhood. Therefore, a reaction may very well be seen from here this week.
Our suggestions: Although the H4 supply boasts a reasonable amount of confluence, there’s little support coming in from the bigger picture. As a result, waiting for the lower timeframes to prove seller interest exists before pulling the trigger may be the better path to take if one is interested in selling from here (see the top of this report for info on how to enter using lower-timeframe structure).
Data points to consider: US personal spending and income (PCE index) figures set for release at 1.30pm and pending home sales at 3pm GMT.
Levels to watch/live orders:
- Buys: Flat (stop loss: N/A).
- Sells: 1.3171-1.3155 ([wait for a lower-timeframe confirming setup to form before looking to execute a trade] stop loss: dependent on where one confirms this area).
USD/CHF:
Weekly gain/loss: – 20 pips
Weekly closing price: 0.9989
Weekly opening price: 0.9965
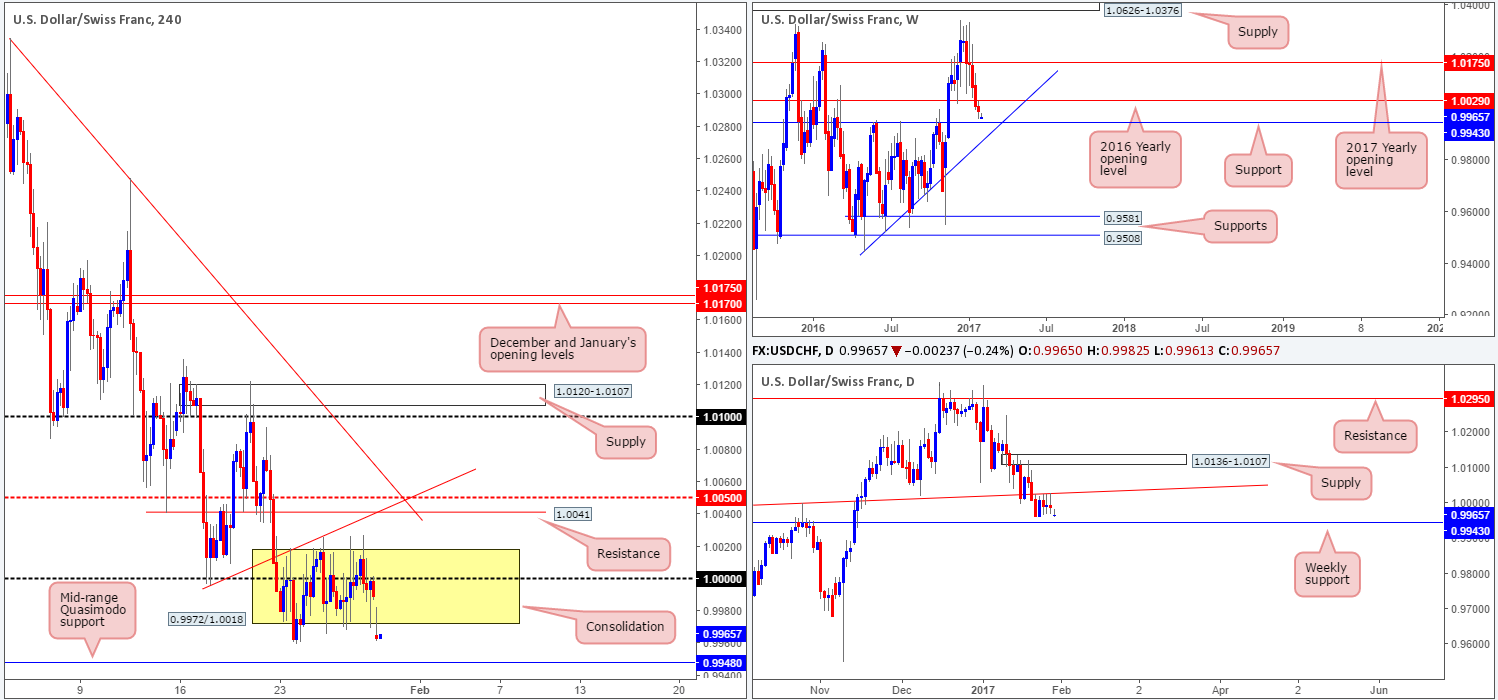
Last week’s descent marks the pair’s fifth consecutive losing week, with the unit managing to touch a low of 0.9959. As a consequence of this, and assuming that the bears can defend the 2016 yearly opening level as resistance at 1.0029, the next downside objective in the firing range is a weekly support carved from 0.9943.
Turning our attention down to the daily chart, we can see that the daily trendline resistance taken from the high 0.9956 continued to cap upside throughout the week, consequently penciling in three back-to-back daily indecision candles. This will, we believe, eventually lead to price testing the aforementioned weekly support level.
Stepping over to the H4 candles, price spent the entire week chiseling out a H4 consolidation zone fixed at 0.9972/1.0018, which happened to house parity (1.0000). In recent hours, however, the market opened on a bearish note, gapping over 20 pips to the downside and placing price within striking distance of the H4 mid-range Quasimodo support at 0.9948.
Our suggestions: Given that the mid-range H4 Quasimodo support level is positioned close to the weekly support level mentioned above at 0.9943, one could look to enter long from here at market since stops can comfortably be placed beyond the H4 Quasimodo apex low (0.9929) at 0.9927.
Data points to consider: US personal spending and income (PCE index) figures set for release at 1.30pm and pending home sales at 3pm GMT.
Levels to watch/live orders:
- Buys: 0.9949 ([possible level to look at buying from without the need for additional confirmation] stop loss: 0.9927).
- Sells: Flat (stop loss: N/A).
DOW 30:
Weekly gain/loss: + 257 points
Weekly closing price: 20075
Weekly opening price: 20021
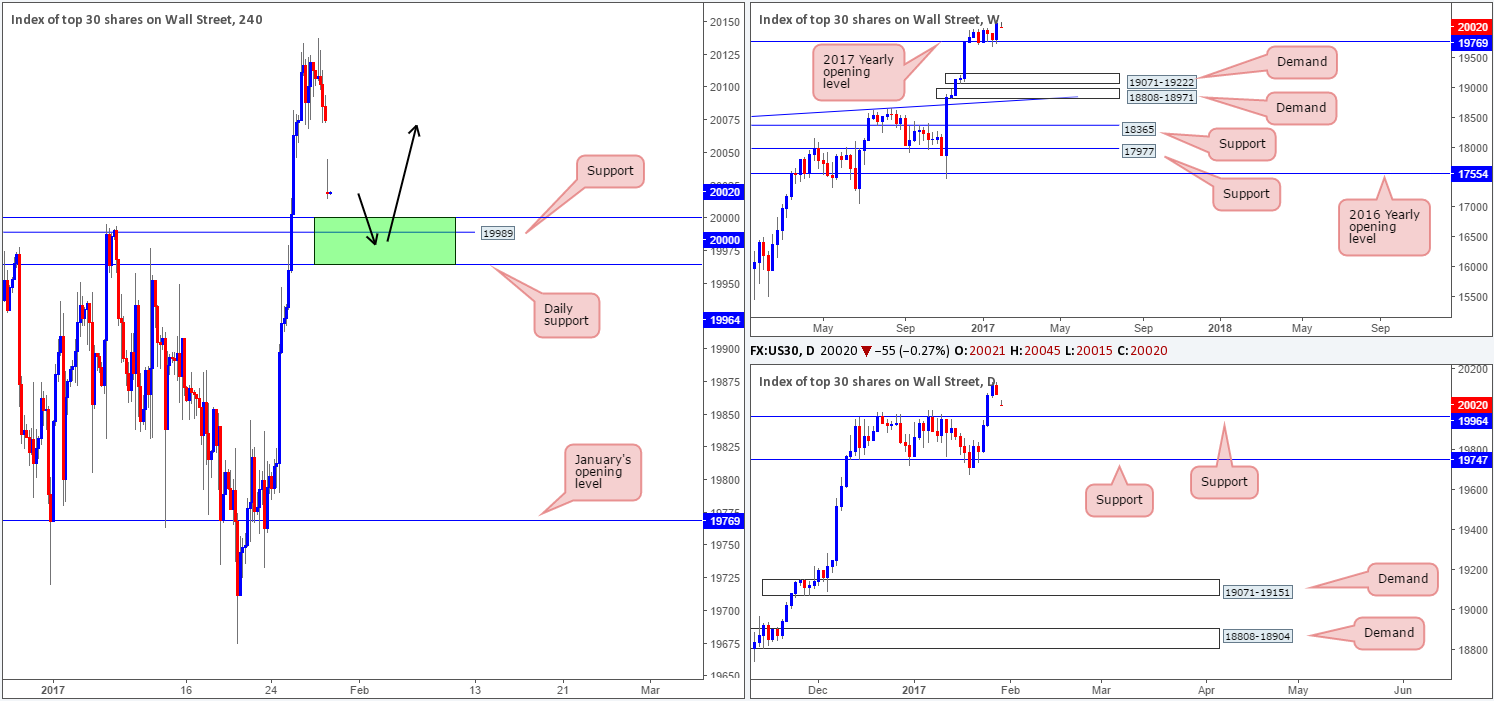
After spending over a month hovering below the 20000 mark, US equities rose beyond this number last week finishing off tapping a high of 20138! In view of this, there are absolutely no resistance levels in this market right now. Therefore, to our way of seeing things, the best we can do for the time being is look to ‘buy the dips’.
As you can see on both the daily and H4 charts, the DOW gapped over 50 points south this morning, planting the market within reaching distance of the 20000 mark, the H4 support at 19989 and the daily support hurdle coming in at 19964.
Our suggestions: Between 19964 and 20000 (green area on the H4 chart) is a zone where we expect stocks to correct from today should price reach this low. Waiting for at least a H4 bull candle to form within the walls of this zone would, in our humble opinion, be the safer, and quite frankly, more logical route to take if one is contemplating a buy from here. As for targets, we would personally be looking to join the trend here and hold medium/long term. However, looking to reduce risk to breakeven and take partial profits off the table once the weekend gap has been filled is something we’ll very likely look to implement.
Data points to consider: US personal spending and income (PCE index) figures set for release at 1.30pm and pending home sales at 3pm GMT.
Levels to watch/live orders:
- Buys: 19964/20000 ([wait for a H4 bull candle to form before looking to execute a trade] stop loss: ideally beyond the trigger candle).
- Sells: Flat (stop loss: N/A).
GOLD:
Weekly gain/loss: – $17.5
Weekly closing price: 1190.9
Weekly opening price: 1189.7
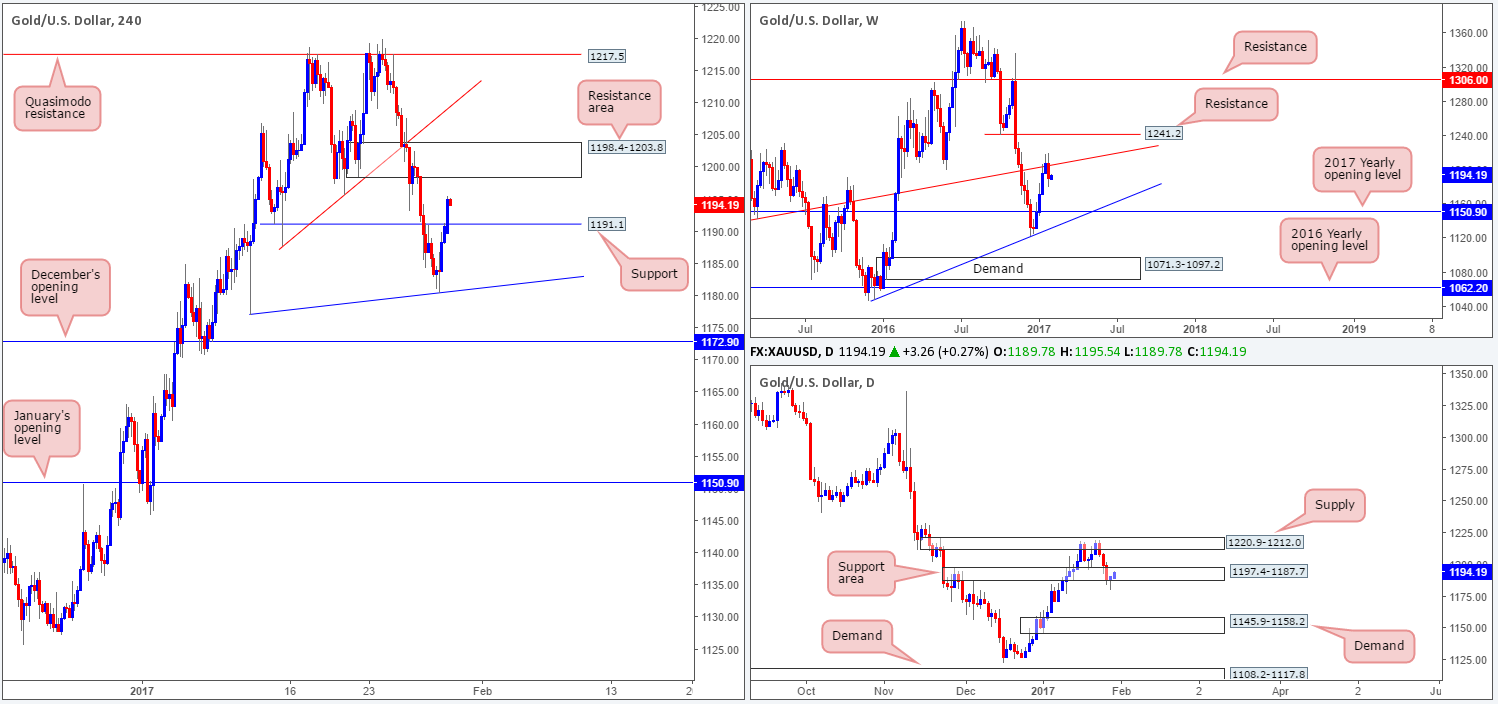
Managing to break a four-week bullish phase, last week’s action printed a strong-looking weekly bearish engulfing candle around the weekly trendline resistance taken from the low 1130.1. On the condition that the bears are able to maintain this momentum this week, it’s possible that we could see further downside given that the next support target does not come into view until the 2017 yearly opening level at 1150.9.
The story on the daily chart shows that Friday’s session chalked in a picture-perfect buying tail that pierced through the lower edge of a daily support area at 1197.4-1187.7. This could, despite what we’ve noted on the weekly timeframe, encourage buyers into the market today/early this week, and potentially pull prices up to daily supply fixed at 1220.9-1212.0.
The H4 candles, however, have begun the week strongly, already breaking through a ceiling of offers around a H4 resistance level at 1191.1. Right now, there’s very little seen stopping price from connecting with the H4 resistance area registered at 1198.4-1203.8.
Our suggestions: As of this moment, we do not see much on offer. Yes, we could look to short from the aforementioned H4 resistance base, but risk an unnecessary loss, since although we’d be selling alongside weekly flow, we’d also be selling into potential daily buyers (see above). As such, our team’s position will remain flat going into today’s segment.
Levels to watch/live orders:
- Buys: Flat (stop loss: N/A).
- Sells: Flat (stop loss: N/A).
