Waiting for lower timeframe confirmation is our main tool to confirm strength within higher timeframe zones, and has really been the key to our trading success. It takes a little time to understand the subtle nuances, however, as each trade is never the same, but once you master the rhythm so to speak, you will be saved from countless unnecessary losing trades. The following is a list of what we look for:
- A break/retest of supply or demand dependent on which way you’re trading.
- A trendline break/retest.
- Buying/selling tails/wicks – essentially we look for a cluster of very obvious spikes off of lower timeframe support and resistance levels within the higher timeframe zone.
- Candlestick patterns. We tend to stick with pin bars and engulfing bars as these have proven to be the most effective.
We typically search for lower-timeframe confirmation between the M15 and H1 timeframes, since most of our higher-timeframe areas begin with the H4. Stops are usually placed 1-3 pips beyond confirming structures.
EUR/USD:
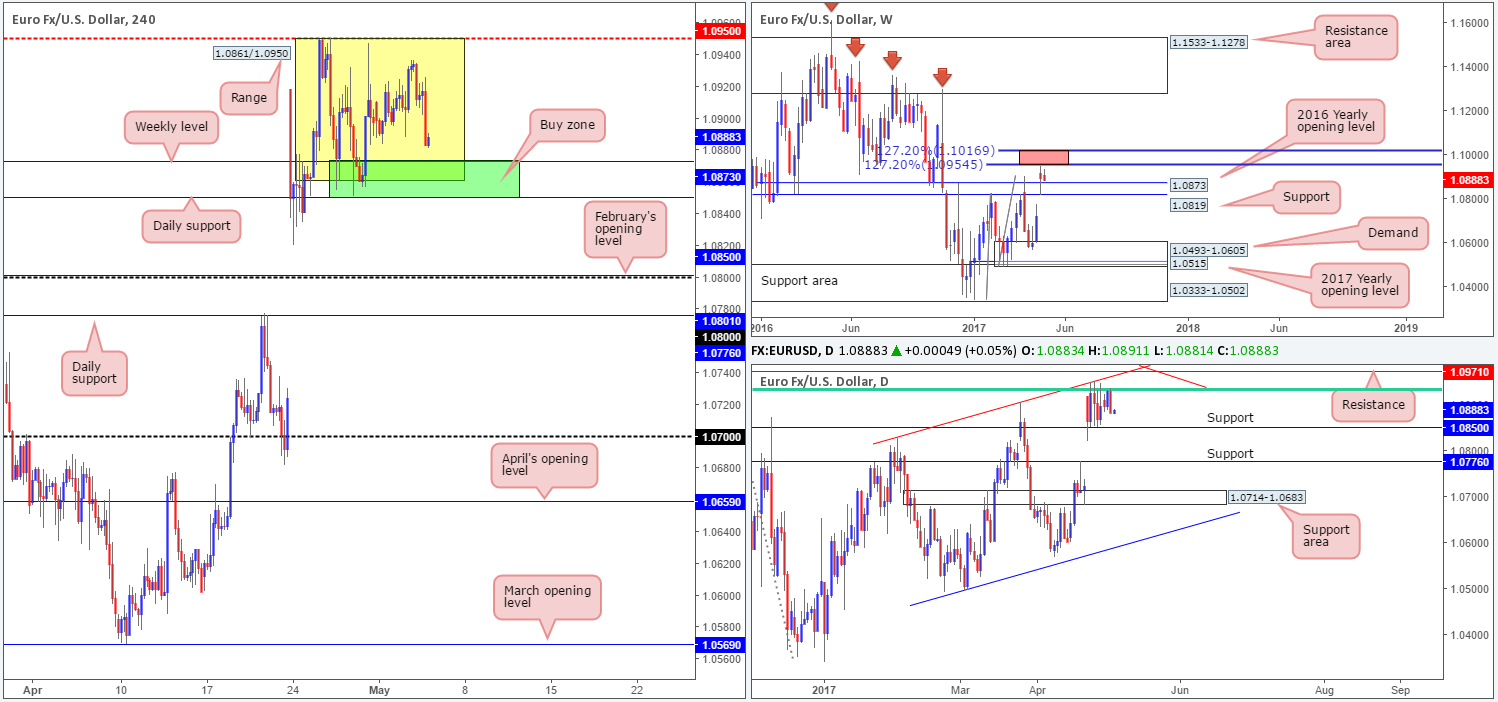
Following a somewhat hawkish FOMC yesterday, the EUR collapsed back below the 1.09 handle as the dollar broke to fresh highs. Despite this recent movement, the pair remains trading within a H4 consolidation fixed between 1.0861/1.0950.
To our way of seeing things, downside is heavily restricted! Not only is the lower edge of the H4 range now in view at 1.0861, there’s also the 2016 yearly opening level (weekly chart) at 1.0873 and a daily support at 1.0850 to contend with. Therefore, a decisive close below this range is going to be challenging. As such, a long trade from here is a reasonable possibility.
Our suggestions: Watch for H4 price to form a reasonably sized bullish candle between 1.0850/1.0873 (preferably a full-bodied candle). Should this come to fruition, a buy trade with an initial target objective of 1.09, followed closely by 1.0932 could be an option.
Data points to consider: ECB President Draghi speaks at 5.30pm. US unemployment claims and trade balance at 1.30pm GMT+1.
Levels to watch/live orders:
- Buys: 1.0850/1.0873 ([waiting for a reasonably sized H4 bull candle to form before pulling the trigger is advised] stop loss: ideally beyond the candle’s tail).
- Sells: Flat (stop loss: N/A).
GBP/USD:
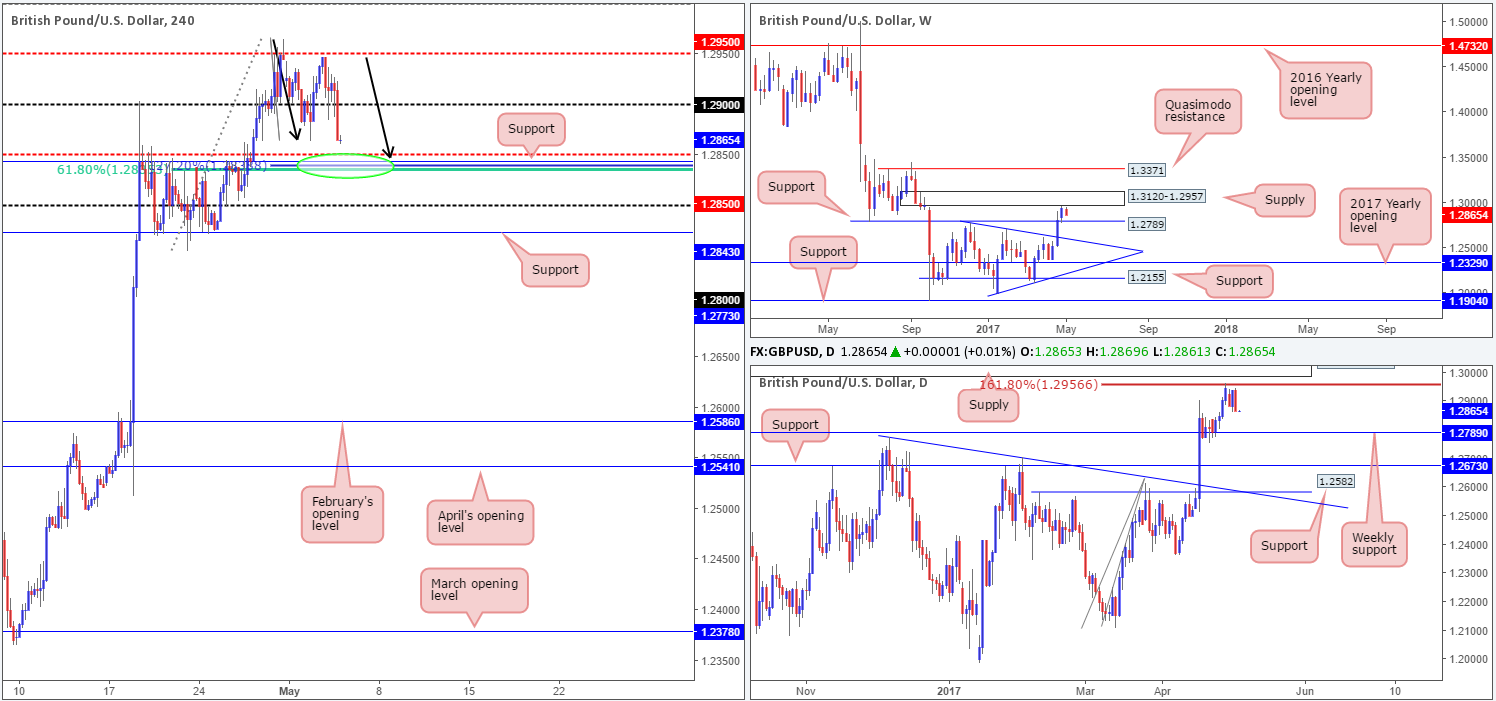
In recent trading, the 1.29 handle was taken out with price managing to reach a low of 1.2865 on the day. With 1.29 out of the picture for the moment this Fed-induced move has brought our attention down to the H4 mid-level support at 1.2850. To make a long story short, we like this region due to the following: a H4 61.8% Fib support at 1.2835, a H4 support at 1.2843 and a 127.2% AB=CD (black arrows) Fib ext. at 1.2838 (taken from the high 1.2965).
While the noted H4 area (1.2835/1.2850) is likely to produce a bounce, traders may also want to take into account that there is a weekly support seen nearby at 1.2789, a few pips below the 1.28 handle. To that end, price may want to test this level before any serious bullish move is seen.
Our suggestions: Given how small the H4 buy zone is at 1.2835/1.2850, we would strongly advise waiting for a lower-timeframe confirming signal to form before committing yourself. This could be either an engulf of supply followed by a retest as demand, a trendline break/retest or simply a collection of lower-timeframe tails seen within the H4 zone. We typically search for lower-timeframe confirmation between the M15 and H1 timeframes, since most of our higher-timeframe areas begin with the H4. Stops are usually placed 1-3 pips beyond confirming structures.
Data points to consider: UK Services PMI at 9.30am. US unemployment claims and trade balance at 1.30pm GMT+1.
Levels to watch/live orders:
- Buys: 1.2850 region ([waiting for a lower-timeframe confirming signal to form before pulling the trigger is advised] stop loss: dependent on where one confirms the area).
- Sells: Flat (stop loss: N/A).
AUD/USD:
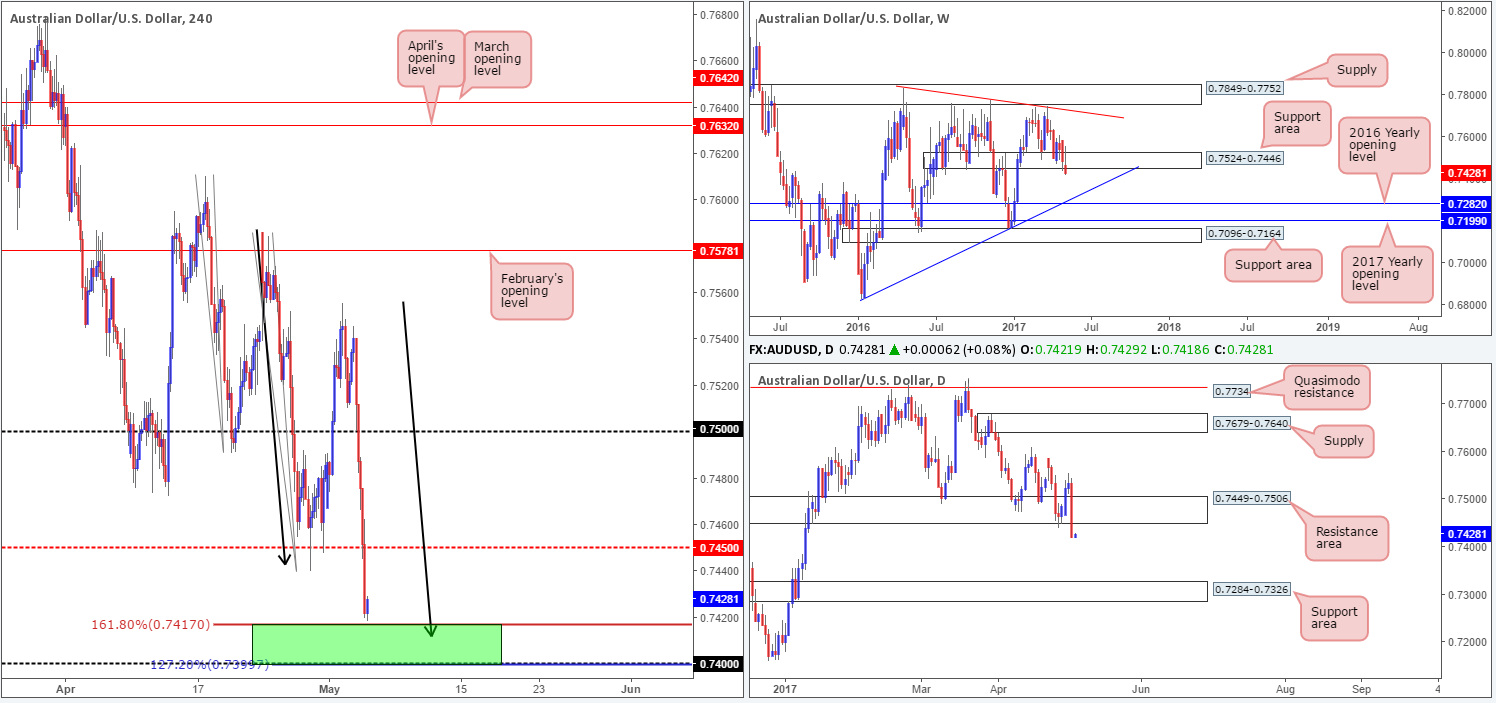
Kicking off this morning’s report with a look-see at the weekly chart, the support area at 0.7524-0.7446 is currently under pressure as price is trading beyond its barriers as we write. Providing that the bears remain in the driving seat here, this could pull the commodity currency down to a trendline support etched from the low at 0.6827. Also of interest is the daily support area at 0.7449-0.7506. As you can see, the zone was wiped out in recent trading, which could imply a move down to the support area at 0.7284-0.7326 (converges with the said weekly trendline support) may be on the cards.
Aggravated by recent FOMC talks, H4 price smashed through the mid-level support at 0.7450 during yesterday’s US segment, and is now seen within touching distance of a 161.8% Fib ext. at 0.7417 taken from the high 0.7610. Couple this with the nearby 0.74 handle and 127.2% AB=CD Fib ext. at 0.7399 drawn from the high 0.7586, we may have a potential reversal zone on our hands (green rectangle).
Our suggestions: Buying from the H4 green zone may be tempting, but given the recent price movement on the bigger picture (see above), our team is reluctant to commit here as we’re ultimately looking to trade in line with higher-timeframe structure. So, unless we happen to see H4 price decisively close beyond 0.74 today, we will be remaining on the sidelines for the time being.
Data points to consider: Australian Trade balance at 2.30am, RBA Gov. Lowe speaks at 4.10am. US unemployment claims and trade balance at 1.30pm GMT+1.
Levels to watch/live orders:
- Buys: Flat (stop loss: N/A).
- Sells: We’ll remain flat unless a H4 close is seen below 0.74.
USD/JPY:
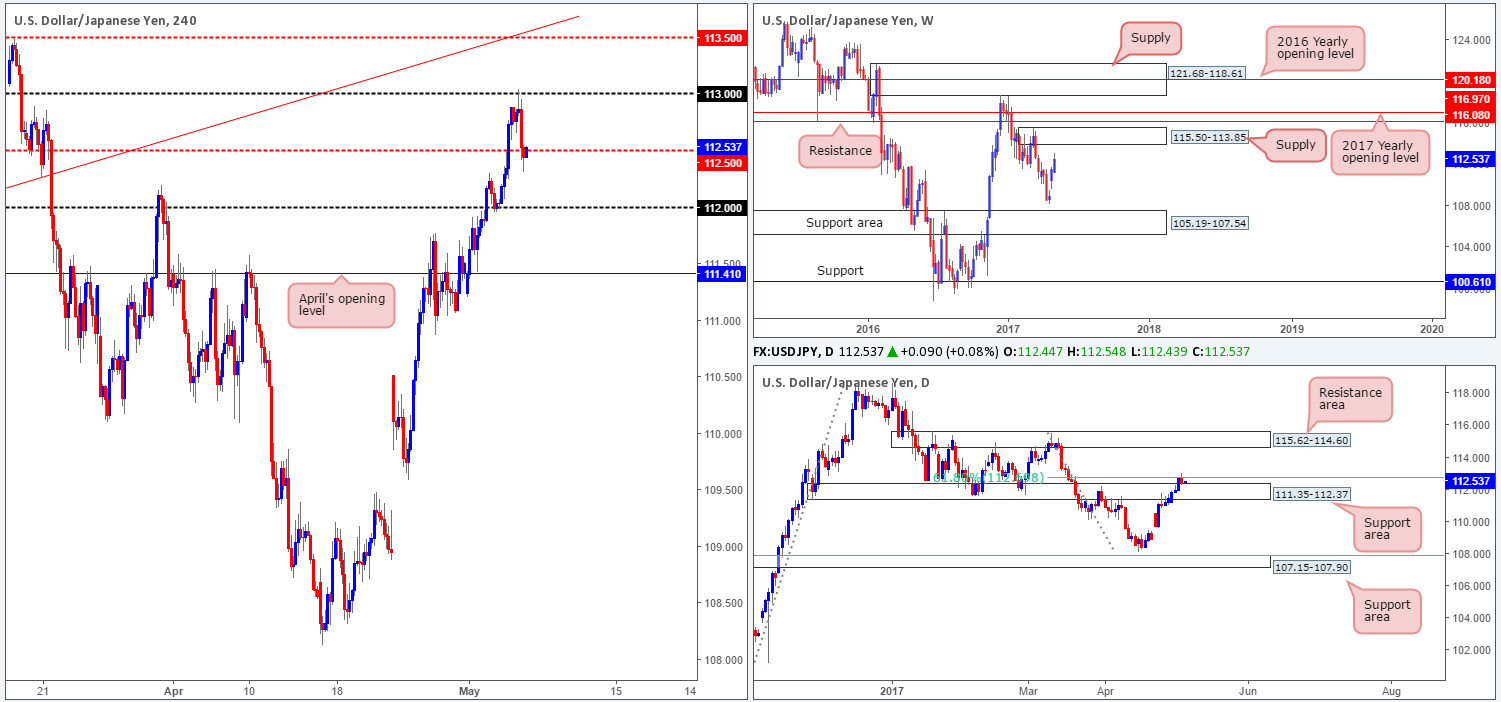
Yesterday’s action shows that the US dollar surged north following the FOMC’s decision to leave momentary policy unchanged. H4 price ripped through offers around the mid-level resistance at 112.50, and has left the door open for the unit to challenge the 113 handle. While some traders may be looking to fade this psychological boundary, we are not so sure. Over on the daily chart, a resistance area at 111.35-112.37 was recently engulfed and may have opened up the path north to a resistance area at 115.62-114.60. Along the same vein, weekly action shows little resistance until we reach supply at 115.50-113.85.
Our suggestions: A H4 close beyond 113 followed up with a retest and a reasonably sized H4 bullish (preferably full-bodied) candle would, in our humble opinion, be enough evidence to suggest the bulls remain in control and longs are now viable. The first take-profit target from here would be set around the H4 mid-level resistance at 113.50 which happens to converge with a H4 trendline resistance taken from the low 111.68, followed by the underside of weekly supply at 113.85.
Data points to consider: US unemployment claims and trade balance at 1.30pm GMT+1.
Levels to watch/live orders:
- Buys: Watch for H4 price to close above 113 and then look to trade any retest seen thereafter ([waiting for a reasonably sized H4 bullish candle to form following the retest is advised] stop loss: ideally beyond the candle’s tail).
- Sells: Flat (stop loss: N/A).
USD/CAD:
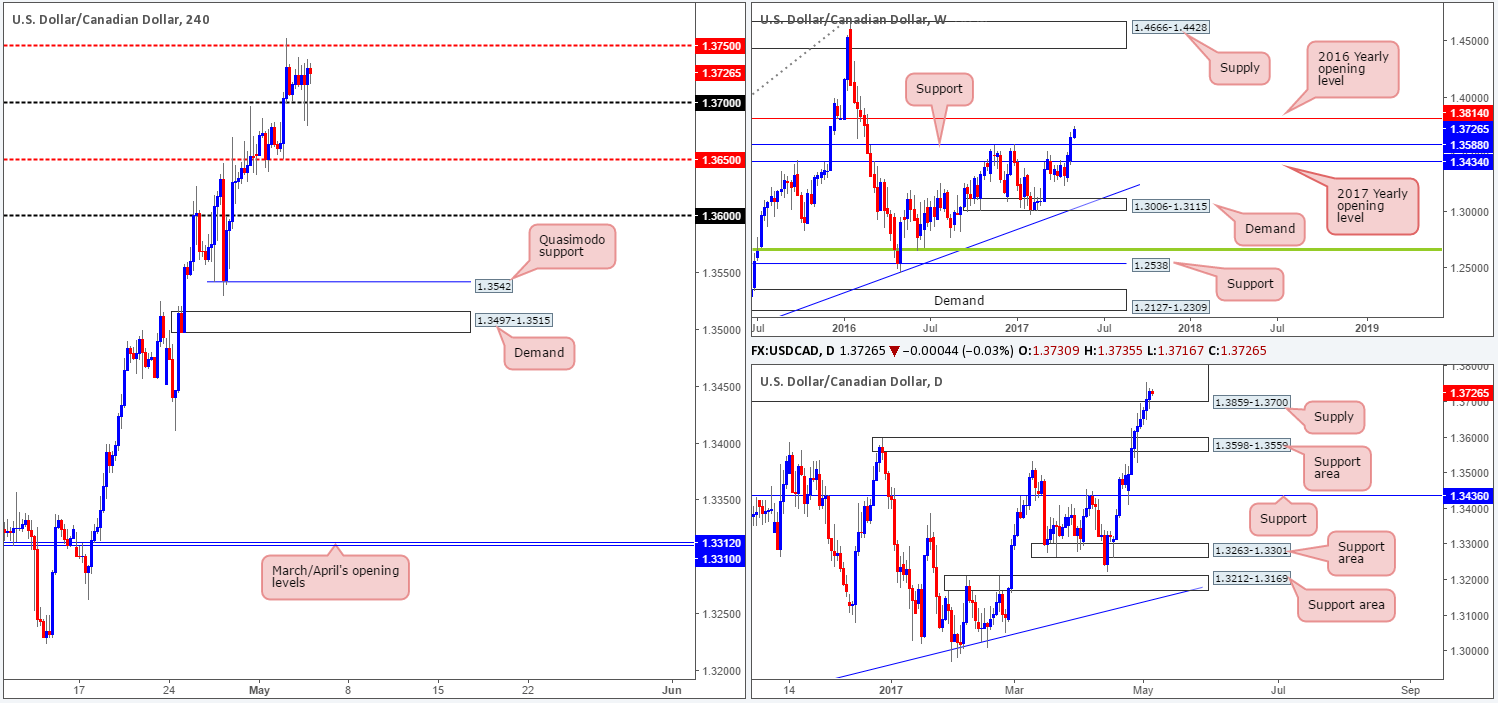
Despite the Fed taking center stage yesterday, albeit offering little surprise, the H4 candles remained confined between the 1.37 handle and the H4 mid-level resistance line at 1.3750. Although daily buyers printed their 9th consecutive bullish candle, our team’s bias continues to favor the downside. Our reasoning lies within the higher-timeframe structures. Daily price has recently checked in with a supply zone penciled in at 1.3859-1.3700. And weekly flow looks poised to attack the 2016 yearly opening level at 1.3814, which happens to sit nicely within the upper limits of the said daily supply.
Our suggestions: To our way of seeing things, entering long (medium/long term) is not a viable option at present. Shorts on the other hand, are. However, given our conservative nature, we would not be looking to commit until price has connected with the above noted 2016 yearly opening level (essentially around the 1.38 region). The reason being, as mentioned above, is that this line firmly positioned within the said daily supply and thus allows the trader to conservatively place stops above this area.
Data points to consider: US unemployment claims and trade balance, along with Canadian Trade balance at 1.30pm. Also we have BoC Gov. Poloz speaking at 9.25pm GMT+1.
Levels to watch/live orders:
- Buys: Flat (stop loss: N/A).
- Sells: 1.3814/1.38 region is an ideal place for shorts since this area requires no additional confirmation (stop loss: conservative at 1.3861).
USD/CHF:
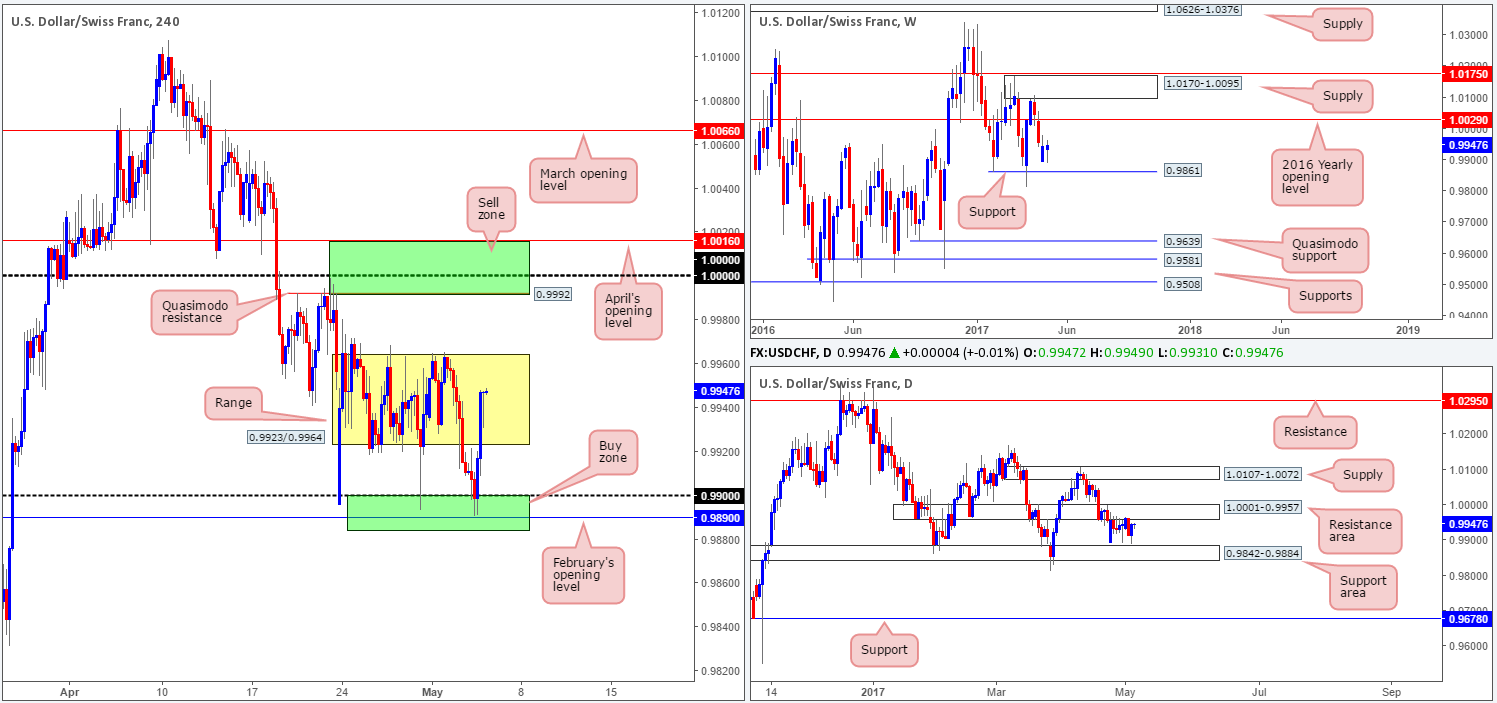
For those who read Wednesday’s report on the Swissy you may recall that our team highlighted the 0.9884/0.99 H4 area as a buy zone (green rectangle). It comprised of the 0.99 handle, February’s opening level at 0.9890 and the top edge of a daily support area at 0.9842-0.9884. As is evident from the H4 chart this morning, the pair bounced from this area beautifully yesterday, and is now seen trading back within its range at 0.9923/0.9964. So, well done to any of our readers who managed to catch this move!
Going forward, as we see it, there’s equal opportunity to trade this pair both long and short today. For shorts, we have the 1.0016/0.9992 region, and for longs, we still believe the above noted H4 buy zone remains worthy of attention. The sell zone consists of April’s opening level at 1.0016, parity (1.0000) and a H4 Quasimodo resistance at 0.9992.
In addition to the above, the H4 sell zone is bolstered by a daily resistance area at 1.0001-0.9957, and the H4 buy zone is reinforced by a daily support area coming in at 0.9842-0.9884.
Our suggestions: While both H4 zones have the ability to hold price and potentially produce a trade for us, there are some cautionary points to consider. If we were to take a long from the said H4 area, there’s a chance that weekly price could potentially push the market lower to shake hands with support at 0.9861. By the same token, a short from the aforementioned H4 sell zone has a risk of being faked due to the 2016 yearly opening level seen above it at 1.0029 (see weekly chart).
As such, we are advising traders not to trade the above said zones blindly! Wait for additional confirmation either in the form of a H4 candle (preferably a full-bodied candle) or a lower-timeframe buy signal (see the top of this report).
Data points to consider: US unemployment claims and trade balance at 1.30pm GMT+1.
Levels to watch/live orders:
- Buys: 0.9884/0.99 ([waiting for a reasonably sized H4 bull candle to form before pulling the trigger is advised] stop loss: ideally beyond the candle’s tail).
- Sells: 1.0016/0.9992 ([waiting for a reasonably sized H4 bear candle to form before pulling the trigger is advised] stop loss: ideally beyond the candle’s wick).
DOW 30:
After spending the best part of a week grinding lower from the H4 resistance at 21020, US equities managed to catch a bid yesterday. Fed officials held the benchmark rates steady during yesterday’s FOMC meeting, which promoted further buying on the DOW.
However, we are in a little bit of a tricky spot right now as far as the technical picture goes. On the one hand, weekly price looks poised to continue marching that could eventually see the market reach a new record high. On the other hand, daily price remains capped by a resistance area at 21022-20933. In addition to this, the H4 candles shows the resistance mentioned above at 21020 unites beautifully with a Quasimodo left shoulder marked with a black arrow at 21028.
Our suggestions: Trading short from the aforementioned H4 resistance is tempting. With that said, however, we do not favor trading against potential weekly buyers who are likely looking to punch higher. On that account, we will continue to remain flat in this market today and look to reassess our position going into tomorrow’s open.
Data points to consider: US unemployment claims and trade balance at 1.30pm GMT+1.
Levels to watch/live orders:
- Buys: Flat (stop loss: N/A).
- Sells: Flat (stop loss: N/A).
GOLD:
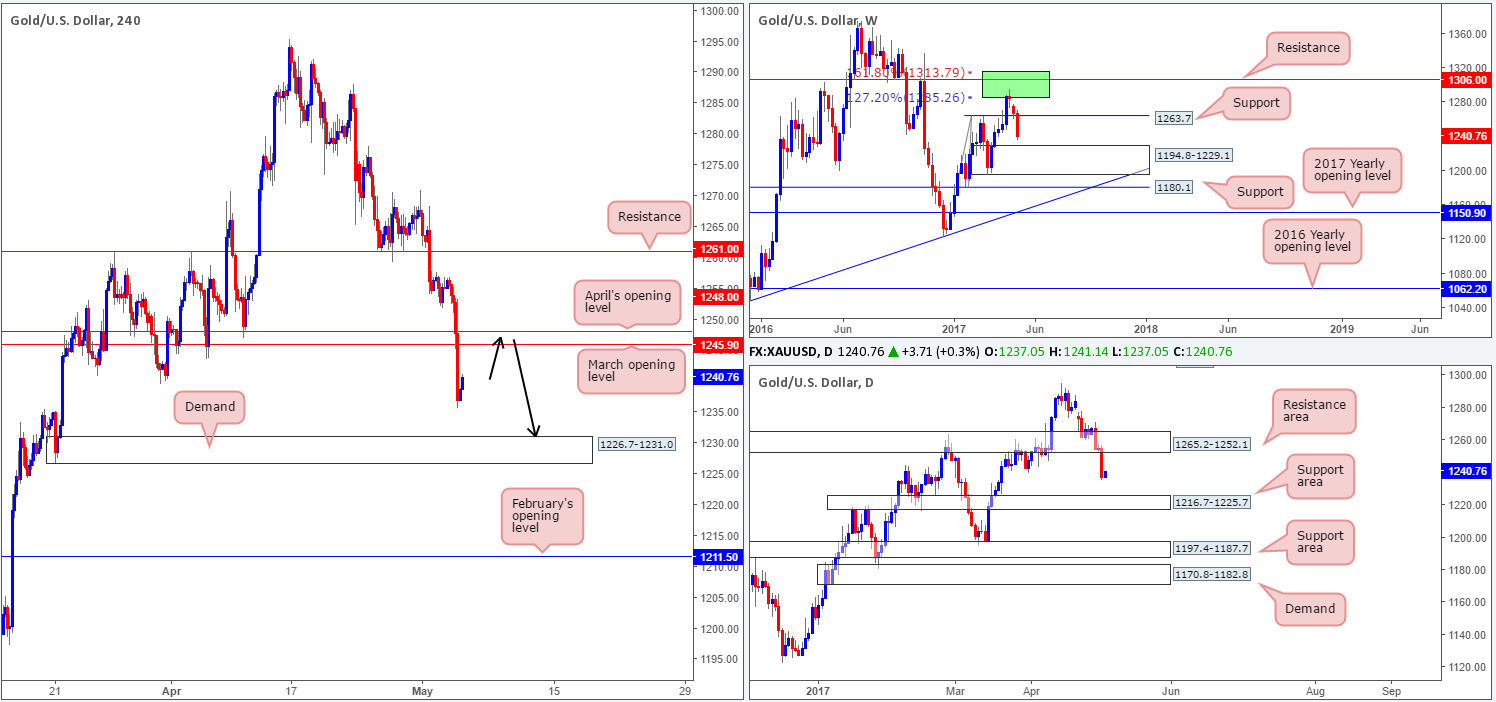
On the back of yesterday’s dollar strength, the gold market took a hit to mid-section and lost over $18 in value. If you look on the weekly chart, this has placed the unit within striking distance of demand penciled in at 1194.8-1229.1. Along similar lines, daily flow also looks like it wants to interact with a support area seen at 1216.7-1225.7, which happens to be positioned within the walls of the said weekly demand base.
Jumping across to the H4 chart, both April’s opening base line at 1248.0 and March’s opening base line at 1245.9 were taken out yesterday, with price reaching a low of 1235.7 on the day. To our way of seeing things, downside is now relatively clear to demand coming in at 1226.7-1231.0. Given this and the higher-timeframe picture (see above), we feel shorts from the 1248.0/1245.9 region (the two said monthly levels) are high probability.
Our suggestions: Seeing as how the 1248.0/1245.9 area is relatively tight, we would advise traders who are looking to short here not to place pending orders. Instead, wait for a reasonably sized H4 bearish candle to form – a full-bodied candle would be ideal – before looking to commit. The take-profit target for this trade should be obvious: the H4 demand base at 1226.7-1231.0, since it sits around the top edge of weekly demand and is located just above the daily support area.
Levels to watch/live orders:
- Buys: Flat (stop loss: N/A).
- Sells: 1248.0/1245.9 ([waiting for a reasonably sized H4 bear candle to form before pulling the trigger is advised] stop loss: ideally beyond the candle’s wick).
