Waiting for lower timeframe confirmation is our main tool to confirm strength within higher timeframe zones, and has really been the key to our trading success. It takes a little time to understand the subtle nuances, however, as each trade is never the same, but once you master the rhythm so to speak, you will be saved from countless unnecessary losing trades. The following is a list of what we look for:
- A break/retest of supply or demand dependent on which way you’re trading.
- A trendline break/retest.
- Buying/selling tails/wicks – essentially we look for a cluster of very obvious spikes off of lower timeframe support and resistance levels within the higher timeframe zone.
- Candlestick patterns. We tend to stick with pin bars and engulfing bars as these have proven to be the most effective.
We typically search for lower-timeframe confirmation between the M15 and H1 timeframes, since most of our higher-timeframe areas begin with the H4. Stops are usually placed 1-3 pips beyond confirming structures.
EUR/USD:
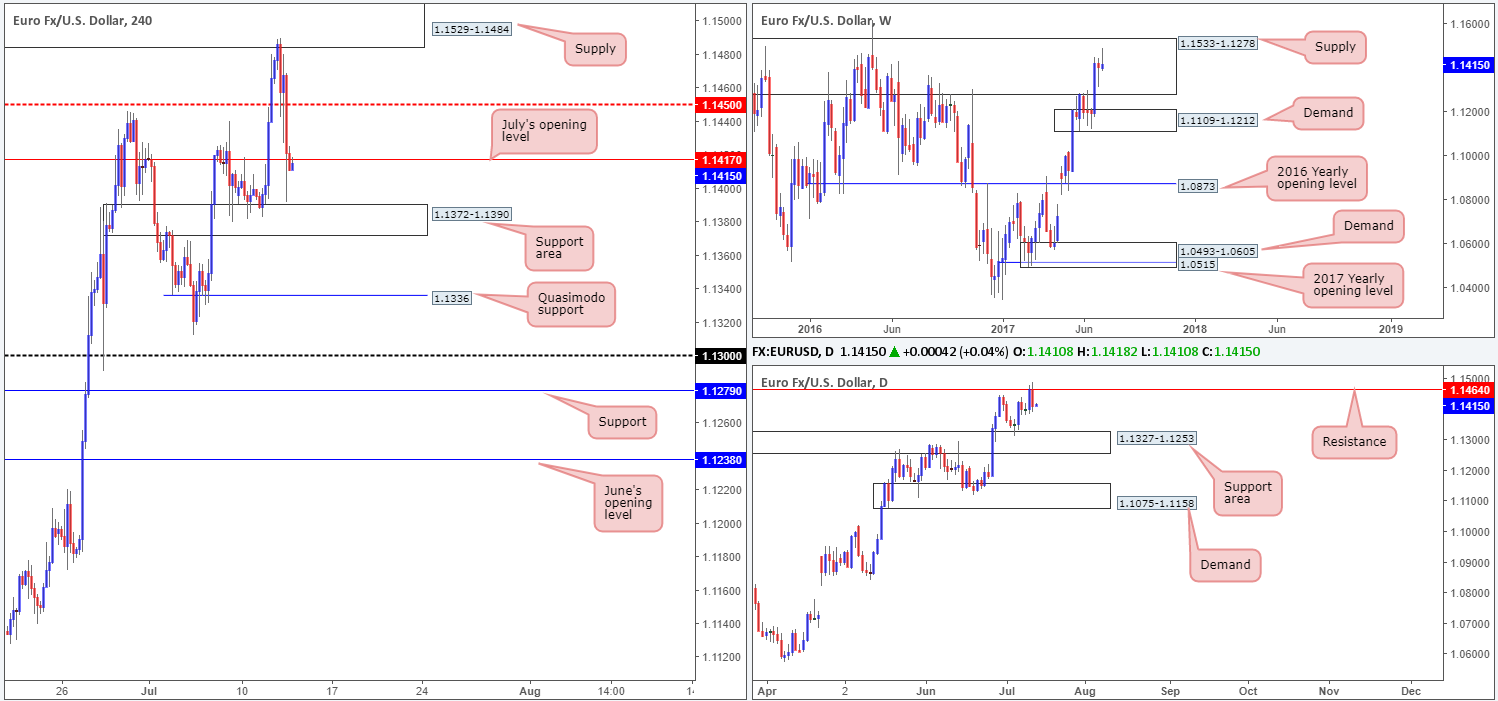
For those who read Wednesday’s report you may recall that our desk placed a pending sell order around the lower edge of a fresh H4 supply at 1.1484. As can be seen from the H4 chart, the order filled beautifully during the early hours of yesterday’s segment and has reached the first take-profit zone: July’s opening level at 1.1417. We have taken 50% off the table here and reduced risk to breakeven.
Ultimately, we do believe the unit will continue to push lower going forward, since weekly price remains loitering within the walls of a major weekly supply drawn from 1.1533-1.1278 (that has capped upside since May 2015). Alongside this, we can also see daily action showing room to trade down to at least the support area coming in at 1.1327-1.1253.
Our suggestions: With the above notes in mind, our final take-profit level has been set at the H4 Quasimodo support pegged from 1.1336, just nine pips above the top edge of the aforementioned daily support area.
Other than our current trade, we do not see much else to hang our hat on right now. Trying to join the sellers at current price would be challenging given that we have a H4 support area at 1.1372-1.1390 lurking nearby!
Data points to consider: US PPI figures and US Weekly unemployment claims at 1.30pm, Fed Chair Yellen testifies at 3pm, FOMC member Evans speaks at 4.30pm, FOMC member Brainard speaks at 6pm GMT+1.
Levels to watch/live orders:
- Buys: Flat (stop loss: N/A).
- Sells: 1.1484 (stop loss: breakeven).
GBP/USD:
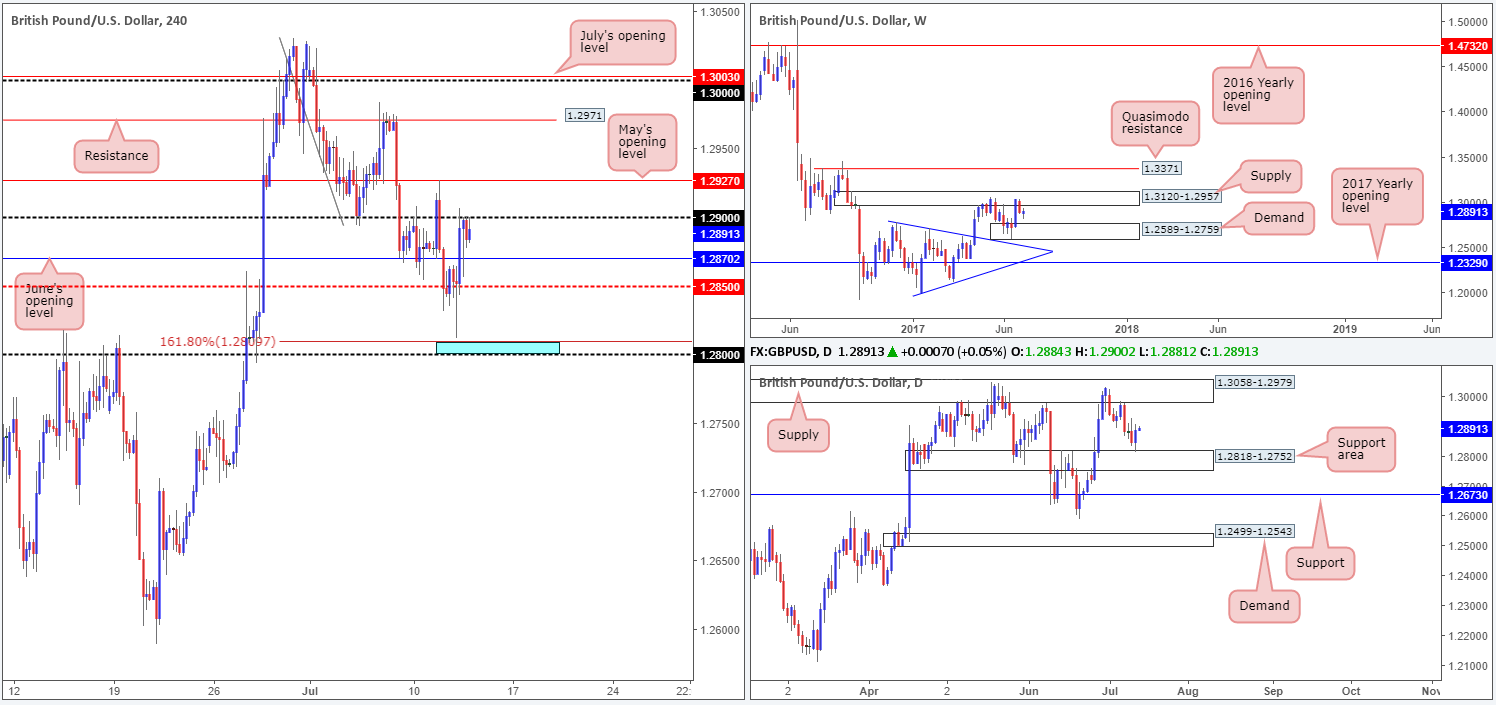
In recent trading, we can see that the GBP/USD came within a cat’s whisker of clipping the H4 blue buy zone at 1.28/1.2809 (comprised of a round number and a 161.8% Fib ext. point at 1.2809 taken from the high 1.3030), before reversing to the upside. The pair gathered momentum following a stronger-than-expected UK job’s report, consequently pushing H4 price above the mid-level resistance seen at 1.2850.
As you can see, the bulls continued to lift this market higher, eventually tagging the 1.29 handle going into the early hours of the US segment, which remained firm going into the closing bell.
Traders may have also noticed that daily price recently crossed swords with the support area formed at 1.2818-1.2752. While this is considered a bullish signal, let’s not forget that weekly action remains trading from a supply at 1.3120-1.2957, with the next downside target being seen around demand pegged at 1.2589-1.2759.
Our suggestions: H4 structure looks incredibly restricted right now. A few pips above 1.29 is May’s opening level at 1.2927, and directly below 1.29 we have June’s opening level at 1.2870. In addition to this, we also have conflicting signals coming in from the weekly and daily charts (see above). Therefore, our team’s position will remain flat going into today’s sessions.
Data points to consider: US PPI figures and US Weekly unemployment claims at 1.30pm, Fed Chair Yellen testifies at 3pm, FOMC member Evans speaks at 4.30pm, FOMC member Brainard speaks at 6pm GMT+1.
Levels to watch/live orders:
- Buys: Flat (stop loss: N/A).
- Sells: Flat (stop loss: N/A).
AUD/USD:
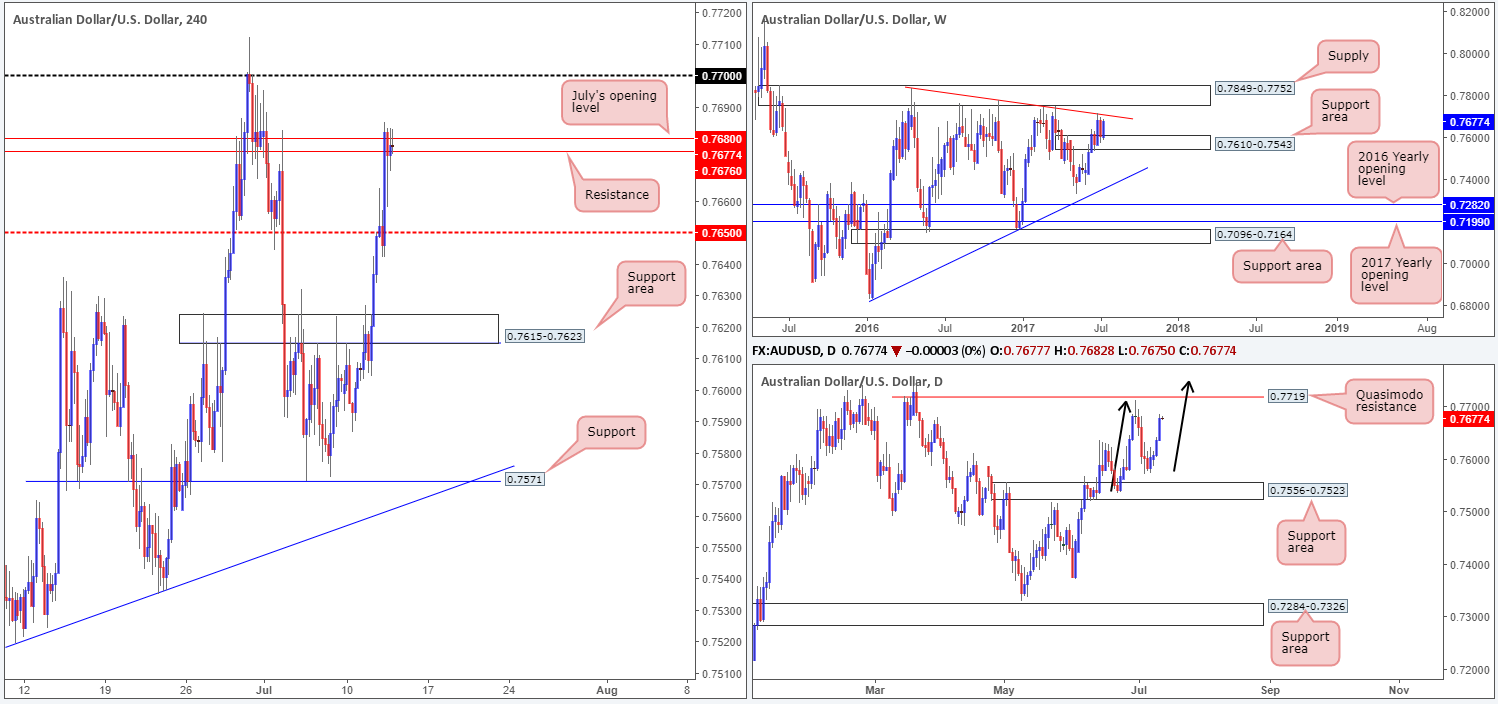
The commodity currency rallied for a fourth consecutive day on Wednesday, reaching a high of 0.7685. The move has brought the current weekly candle up to within striking distance of the weekly trendline resistance drawn from the high 0.7835. Should the unit breach this line, however, the bulls won’t have far to go to find trouble since there’s a nearby weekly supply sitting a few pips above at 0.7849-0.7752.
Looking down to the daily chart, the next upside target does not come into view until we reach 0.7719: a Quasimodo resistance line that’s positioned just above the said weekly trendline. What’s also interesting on this scale is the AB=CD formation currently setting up (black arrows) that terminates around the underside of the weekly supply mentioned above at 0.7752.
Across on the H4 candles, the buyers and sellers are currently seen battling it out around a H4 resistance level at 0.7676/July’s opening level at 0.7680. The next port of call beyond these two barriers is the 0.77 handle, which is positioned a few pips below the aforementioned weekly trendline resistance.
Our suggestions: As of current price, we have no immediate trade recommendation. However, we really like the look of the daily AB=CD pattern given where it completes. To that end, we feel the bulls will continue to push this market higher today, with the likelihood of the 0.77 handle being consumed. We must be clear here though that we have no interest in trading this market UNTIL price has connected with the 0.7750 neighborhood (stops would likely be positioned above the high formed back on the 8th Nov 2016 at 0.7778).
Data points to consider: US PPI figures and US Weekly unemployment claims at 1.30pm, Fed Chair Yellen testifies at 3pm, FOMC member Evans speaks at 4.30pm, FOMC member Brainard speaks at 6pm GMT+1.
Levels to watch/live orders:
- Buys: Flat (stop loss: N/A).
- Sells: 0.7750 region (stop loss: 0.7780).
USD/JPY:
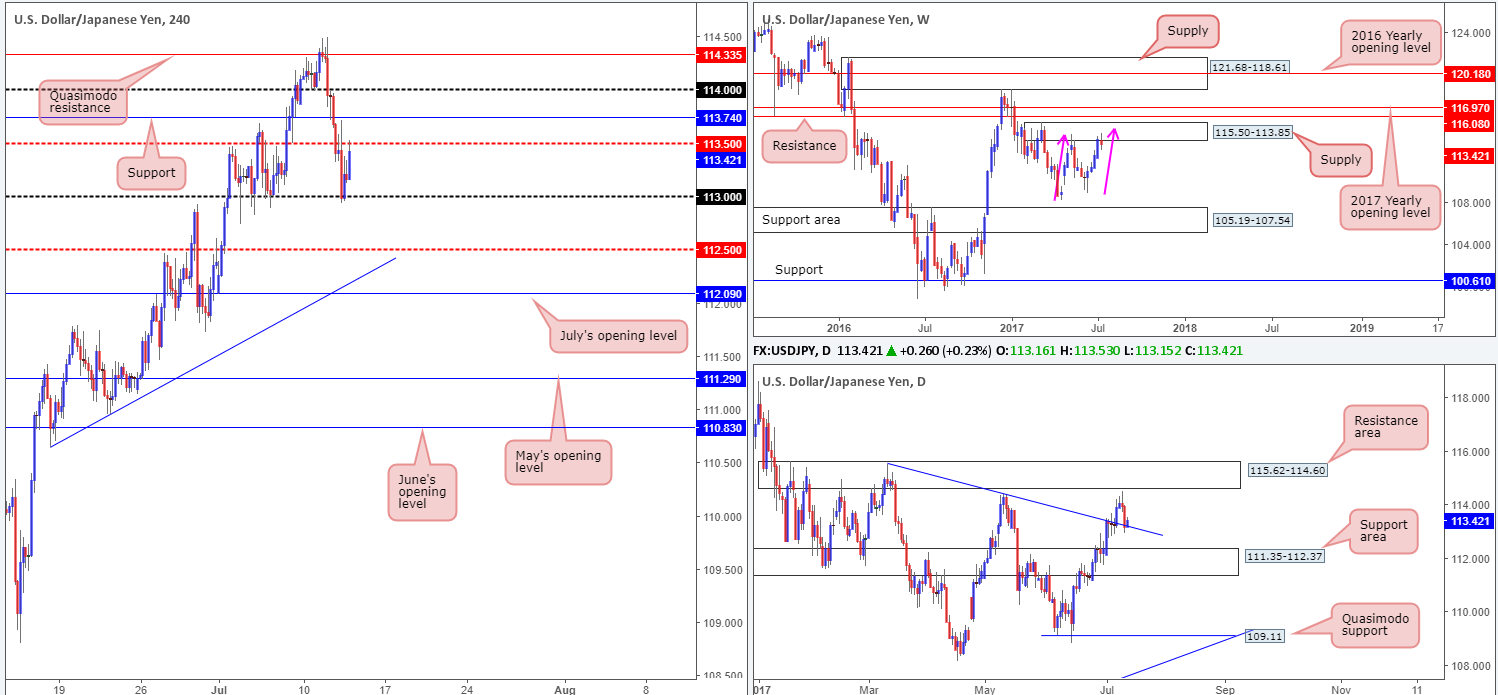
The USD/JPY, as you can see, continued to punch lower during Wednesday’s sessions. It was only once price shook hands with the 113 handle did we see the bulls make an appearance. As we explained yesterday, shorting the market beyond 113.50 was just too restricted given that there was a nearby daily trendline support etched from the high 115.50.
Although we have seen a healthy bounce from 113 that has, in recent hours, brought the unit back up to 113.50, this market is still a tricky beast to trade right now. On the one hand, we have weekly action suggesting that further selling may be on the cards from the supply zone at 115.50-113.85, while on the other hand daily price is seen trading from the aforementioned trendline support.
Our suggestions: While we do believe that this market will eventually drive lower, it is just too chancy for us to sell into a daily trendline support. For that reason, we will not be initiating any trades today.
Data points to consider: US PPI figures and US Weekly unemployment claims at 1.30pm, Fed Chair Yellen testifies at 3pm, FOMC member Evans speaks at 4.30pm, FOMC member Brainard speaks at 6pm GMT+1.
Levels to watch/live orders:
- Buys: Flat (stop loss: N/A).
- Sells: Flat (stop loss: N/A).
USD/CAD:
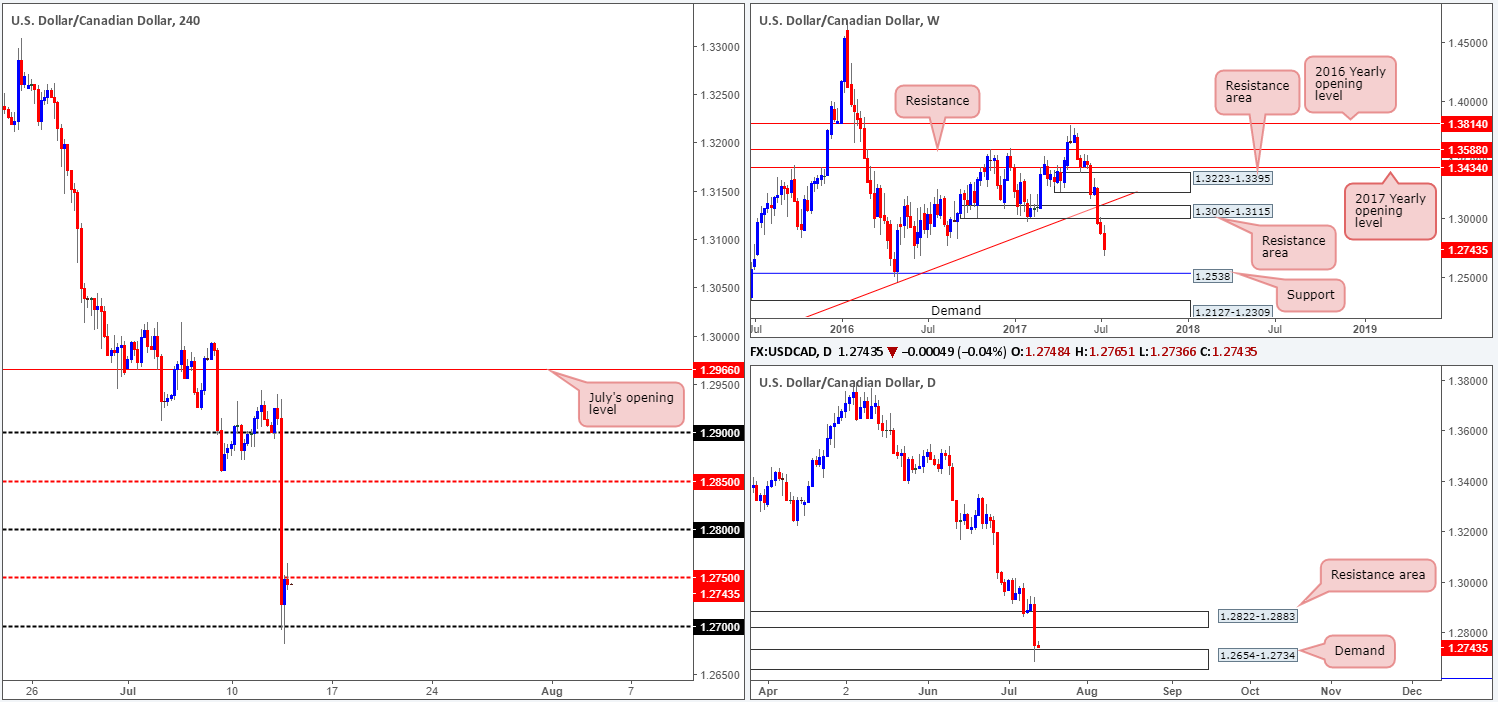
In response to the Bank of Canada increasing its key interest rate from 0.50% to 0.75% yesterday, the USD/CAD steamrolled its way south, and only found refuge once it struck the 1.27 handle (seen encased within a daily demand zone pegged at 1.2654-1.2734).
While yesterday’s move was influenced by a fundamental driver, the weekly technicals, as we’ve been reporting, were in harmony with this move. In fact, the weekly timeframe shows space to continue pressing south all the way down to support coming in at 1.2538.
On the daily timeframe, however, weekly sellers have to contend with not only the current demand base mentioned above at 1.2654-1.2734, but also a daily Quasimodo support level seen below it at 1.2592.
Our suggestions: Watch for a decisive H4 close beyond the 1.27 handle. This would, in our view, signal seller strength on the weekly chart and buyer weakness within the current daily demand, and therefore potentially open up the possibility for a sell trade on any retest seen at 1.27.
Data points to consider: US PPI figures and US Weekly unemployment claims at 1.30pm, Fed Chair Yellen testifies at 3pm, FOMC member Evans speaks at 4.30pm, FOMC member Brainard speaks at 6pm GMT+1.
Levels to watch/live orders:
- Buys: Flat (Stop loss: N/A).
- Sells: Watch for H4 price to engulf the 1.27 handle and then look to trade any retest seen thereafter ([waiting for a H4 bearish candle – preferably in the form of a full, or near-full-bodied candle – to form following the retest is advised] stop loss: ideally beyond the candle’s wick).
USD/CHF:
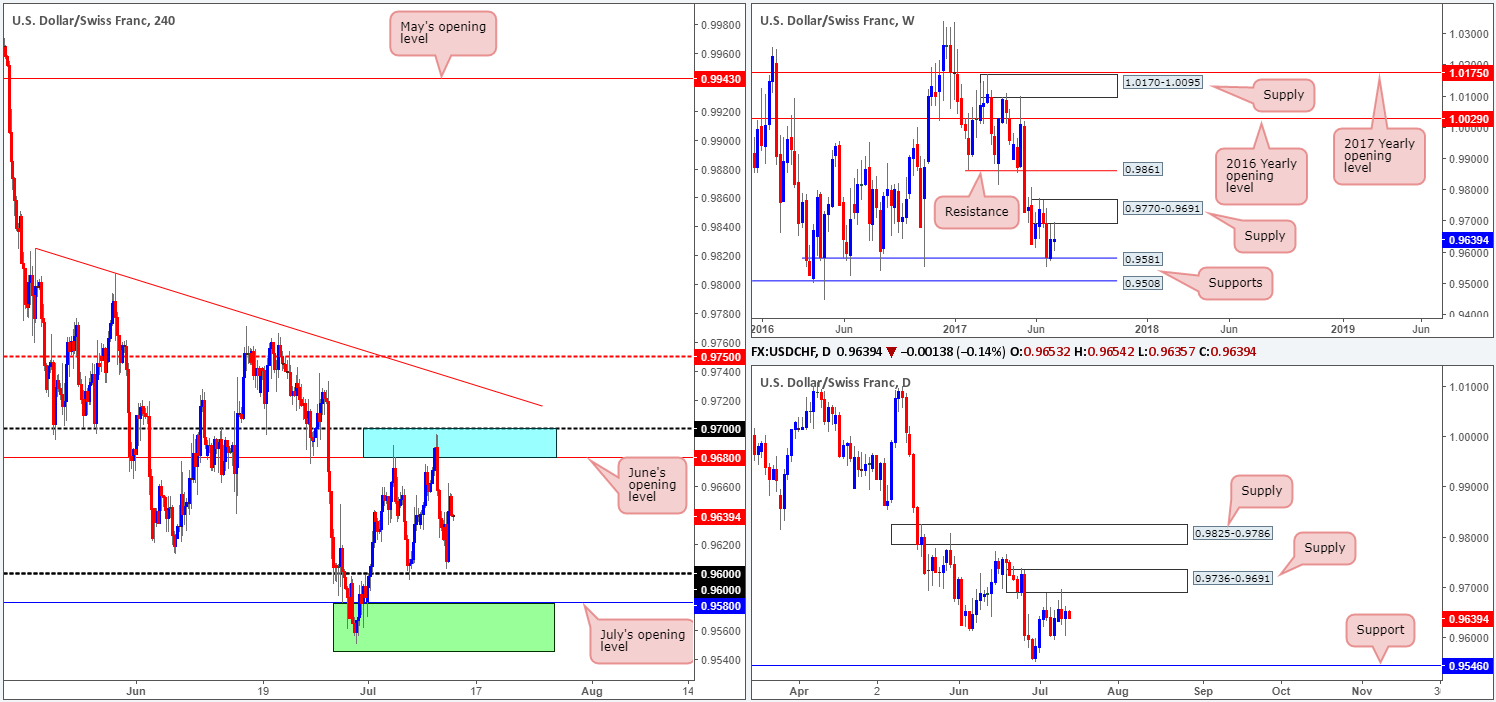
Since the 5th May, the H4 candles have been chiseling out a consolidation zone between 0.97/0.9680 (round number/June’s opening level – blue zone) and the 0.96 handle. What way this range will eventually break is difficult to pin down. This is because on the weekly chart, price is also seen loitering between a supply at 0.9770-0.9691 and a support formed at 0.9581.
Given the above, we are going to keep things very simple today!
We have two zones of interest:
- The first is the blue resistance zone mentioned above at 0.97/0.9680. We’ve selected this area since not only is this barrier lodged around the underside of the said weekly supply, there’s also a partner supply seen on the daily timeframe at 0.9736-0.9691 that’s in play.
- The second zone is a support area marked in green comprised of a daily support at 0.9546 and the weekly support at 0.9581, which also happens to converge closely with July’s opening level at 0.9580.
Our suggestions: Both zones have proved their worth already, in our opinion, so it is just a matter of which one will be tested first.
To initiate a trade at either of the above noted zones, nevertheless, we would require H4 candle confirmation, preferably in the shape of a full, or near-full-bodied candle. This is just a way to confirm that there are other speculators interested in the same zone as we are!
Data points to consider: US PPI figures and US Weekly unemployment claims at 1.30pm, Fed Chair Yellen testifies at 3pm, FOMC member Evans speaks at 4.30pm, FOMC member Brainard speaks at 6pm GMT+1.
Levels to watch/live orders:
- Buys: 0.9546/0.9581 ([waiting for a H4 bull candle – preferably a full, or near full-bodied candle – to form is advised] stop loss: ideally beyond the candle’s tail).
- Sells: 0.97/0.9680 ([waiting for a H4 bear candle – preferably a full, or near full-bodied candle – to form is advised] stop loss: ideally beyond the candle’s wick).
DOW 30:
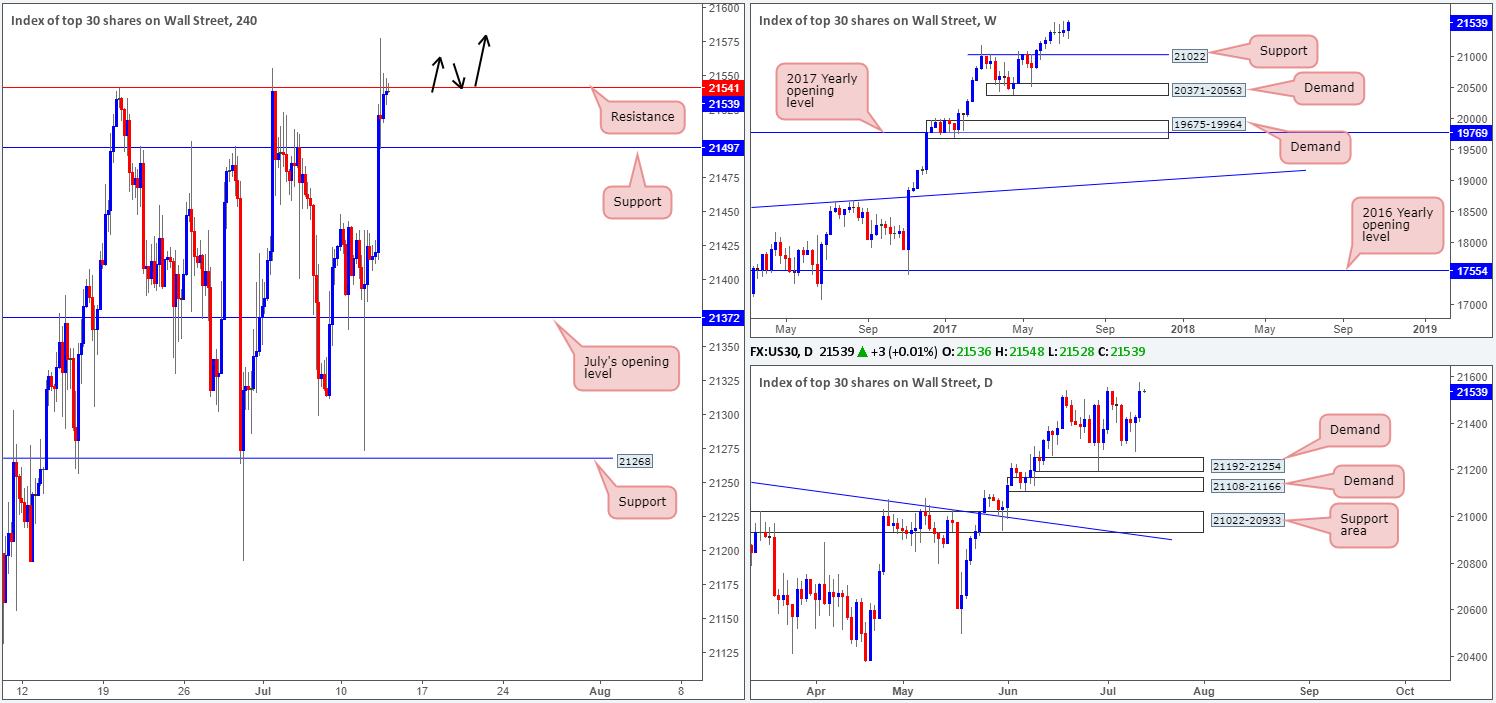
US equities rallied to a fresh all-time high of 21578 yesterday; after Fed Chair Janet Yellen indicated that the Fed will not rush to tighten monetary policy as inflation remains below target.
From a technical perspective, we’re now watching for the H4 candles to print a decisive bull candle above the H4 resistance at 21541. This, to us, would signal further upside and potentially open up the opportunity for traders to long any retest seen thereafter (as per the black arrows).
Our suggestions: Should the above scenario come to fruition, our desk has noted that they would look to trail the position, in the hope of joining the rather steep uptrend the DOW is currently entrenched within right now (see weekly chart).
Data points to consider: US PPI figures and US Weekly unemployment claims at 1.30pm, Fed Chair Yellen testifies at 3pm, FOMC member Evans speaks at 4.30pm, FOMC member Brainard speaks at 6pm GMT+1.
Levels to watch/live orders:
- Buys: Watch for H4 price to close above the current H4 resistance and then look to trade any retest seen thereafter ([waiting for a H4 bull candle – preferably a full, or near full-bodied candle – to form following the retest is advised] stop loss: ideally beyond the candle’s tail).
- Sells: Flat (stop loss: N/A).
GOLD:
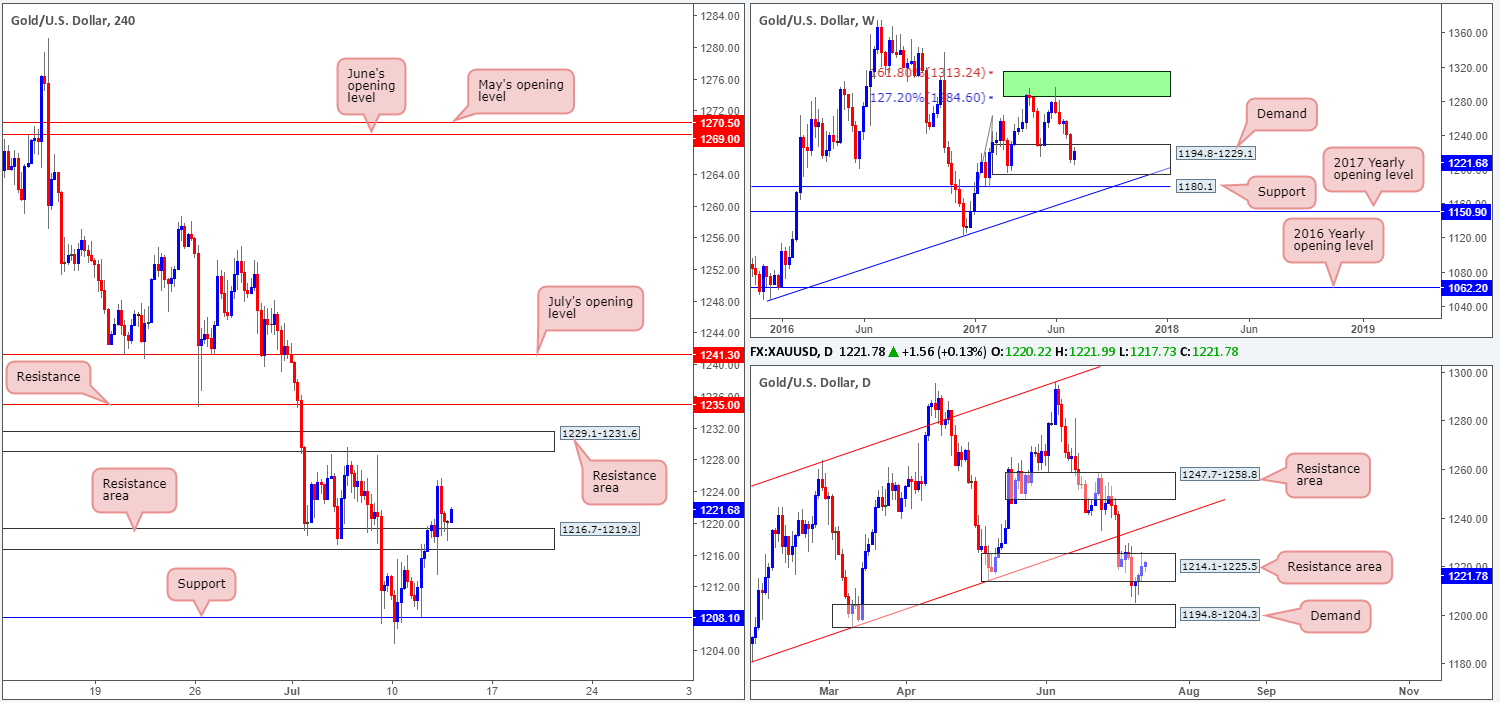
Just to remind ourselves of where we are in the bigger picture on gold at the moment, let’s take a quick look at the weekly and daily chart. Weekly price, as you can probably see, remains loitering within the confines of a demand base coming in at 1194.8-1229.1. As far as the daily chart is concerned, the candles are seen currently trading within a resistance area drawn from 1214.1-1225.5.
As we highlighted in Tuesday’s analysis, before our team can become buyers in this market we said that we would require a decisive H4 close above the H4 resistance area at 1216.7-1219.3. This occurred during yesterday’s segment and has, in recent hours, printed a rather attractive H4 buying tail off this area on the retest. For us, this is enough evidence to suggest that the current daily resistance area is weakened and the H4 candles will likely reach the H4 resistance area at 1229.1-1231.6, followed closely by H4 resistance at 1235.0.
Our suggestions: Since we are currently short the EUR/USD pair, which typically correlates with the price of gold, we have opted not to take advantage of this setup, unfortunately. But for those who have no position in the EUR market, this could be an opportunity to enter long.
Levels to watch/live orders:
- Buys: @ current price is a valid long with stops planted below the H4 buying tail just printed at 1217.2.
- Sells: Flat (stop loss: N/A).
