Japanese banks closed in observance of Coming-of-Age Day.
EUR/USD:
Weekly gain/loss: +0.26%
Weekly closing price: 1.2027
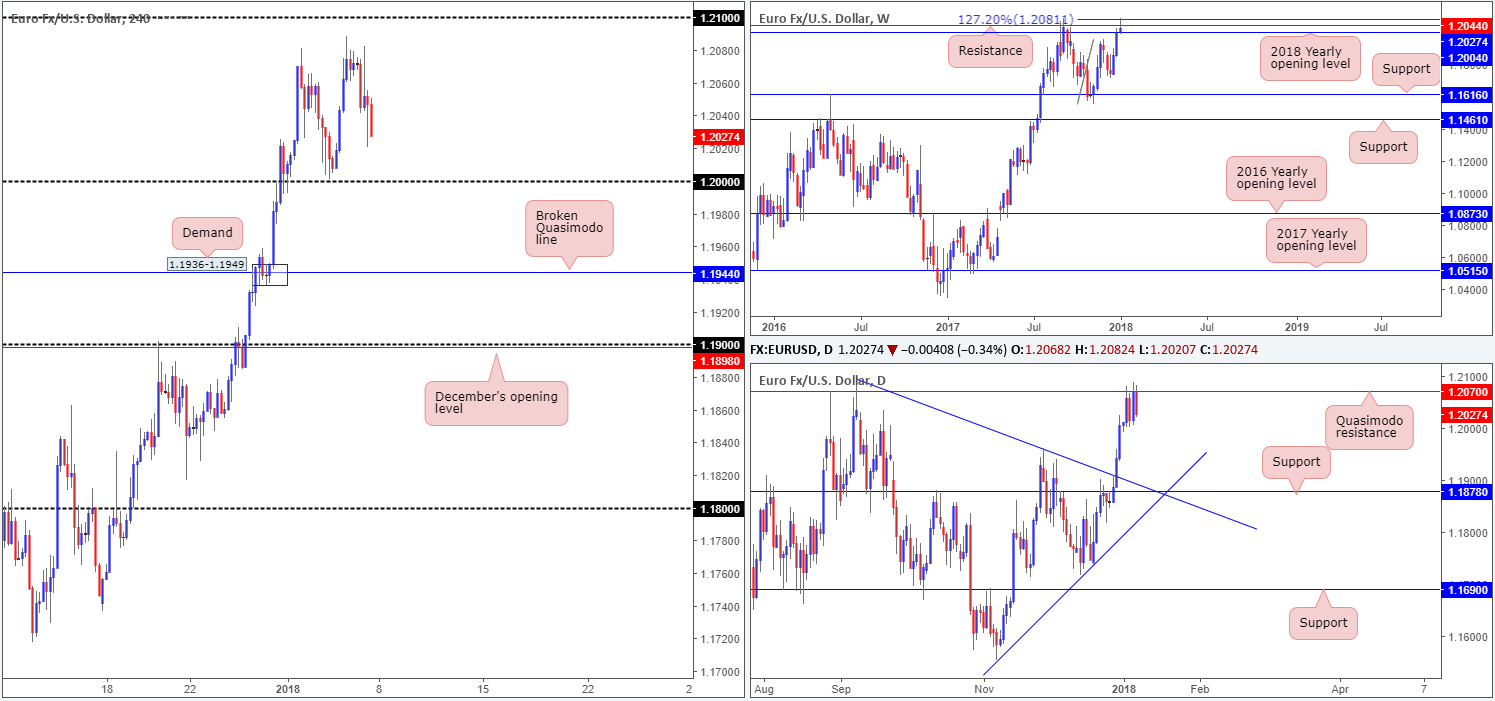
Despite the fact that the EUR/USD ended the week in the green, the pair chalked up a weekly bearish selling wick around a weekly resistance level coming in at 1.2044, and a 127.2% weekly Fib ext. point at 1.2081. This could point to a potential breach of the 2018 yearly opening level seen on the weekly timeframe at 1.2004 this week.
In conjunction with weekly structure, the daily candles show that price spent the best part of last week probing a daily Quasimodo resistance level at 1.2070, seen a few pips beneath the aforesaid weekly Fib extension. Should Friday’s closing candle, shaped in the form of a near-full-bodied daily bearish candle, be enough confirmation to attract further selling, the next daily support target in range can be seen at 1.1878 which happens to boast strong daily trendline confluence.
The immediate aftermath of Friday’s dismal US employment report saw a push to highs of 1.2082. The move, however, was a short-lived one as price trimmed gains and struck a low of 1.2020. Near-term H4 action shows the large psychological number 1.20 is likely going to be brought into the fray today, which is positioned nearby the 2018 yearly opening level mentioned above at 1.2004. As a result, this area will likely attract fresh buyers.
Market direction:
According to the technicals, selling from the noted weekly and daily resistances should only be considered valid upon a firm break of 1.20. A violation of this level possibly opens the river south down to at least the H4 broken Quasimodo line at 1.1944, which, as you can see, is accompanied by a H4 demand base at 1.1936-1.1949. A close below 1.20, followed up with a clean retest of the level as resistance is a promising sign that the bears may look to take things lower.
A buy from 1.20 is also interesting given its connection to the 2018 yearly opening level at 1.2004. Be that as it may, this yearly level has yet to prove itself and therefore may fail considering the resistances seen directly above it!
Data points to consider: FOMC member Bostic speaks at 5.40pm; FOMC member Williams speaks at 6.35pm GMT.
Areas worthy of attention:
Supports: 1.20 handle; 1.1936-1.1949; 1.1944; 1.2004; 1.1878.
Resistances: 1.2081; 1.2044; 1.2070.
GBP/USD:
Weekly gain/loss: +0.43%
Weekly closing price: 1.3563
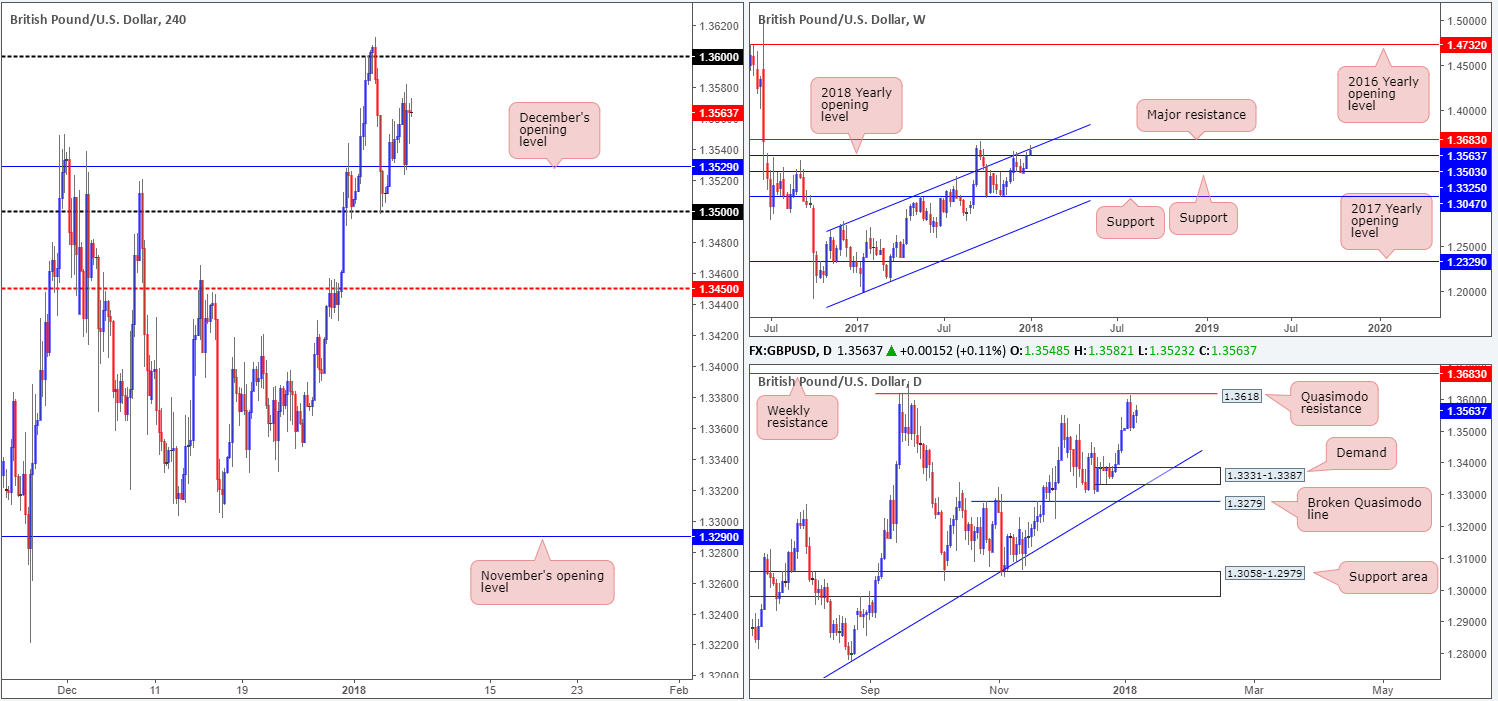
The value of the British pound advanced for a third consecutive session during the course of last of last week’s trading. This, as you can see, lifted the pair to a weekly high of 1.3612 and saw the unit shake hands with a weekly channel resistance extended from the high 1.2673. In the case that this channel is engulfed, the path north should be clear up to a nearby weekly resistance plotted at 1.3683. A rejection of the channel, however, could possibly be hindered by the 2018 yearly opening level seen on the weekly timeframe at 1.3503.
Turning our attention to the daily timeframe, we can see that a daily Quasimodo resistance at 1.3618 can be seen providing additional mettle for the aforementioned weekly channel resistance. Further selling on this scale could see price approach the daily demand printed at 1.3331-1.3387, which happens to merge with a daily trendline support taken from the low 1.2108.
A quick recap of Friday’s movement on the H4 timeframe reveals that the GBP spiked to a session high of 1.3582, following a disappointing US non-farm payrolls number (148K vs. expected 190k). As can be seen from this timeframe, December’s opening level at 1.3529 sits a few pips above the noted 2018 yearly opening level seen on the weekly timeframe at 1.3503, and the 1.35 handle.
Market direction:
Technically speaking, this is a somewhat restricted market at the moment. To the upside, we have a weekly channel resistance and a daily Quasimodo resistance level at 1.3618. To the downside, December’s opening level on the H4 timeframe is likely the first port of call, followed closely by the 2018 yearly opening line and the 1.35 handle.
On account of the above, neither a long nor short seems attractive right now.
Data points to consider: UK Halifax HPI m/m at 10am; FOMC member Bostic speaks at 5.40pm; FOMC member Williams speaks at 6.35pm GMT.
Areas worthy of attention:
Supports: 1.3529; 1.3503; 1.35 handle; 1.3331-1.3387; daily trendline support.
Resistances: Weekly channel resistance; 1.3683; 1.3618.
AUD/USD:
Weekly gain/loss: +0.79%
Weekly closing price: 0.7858
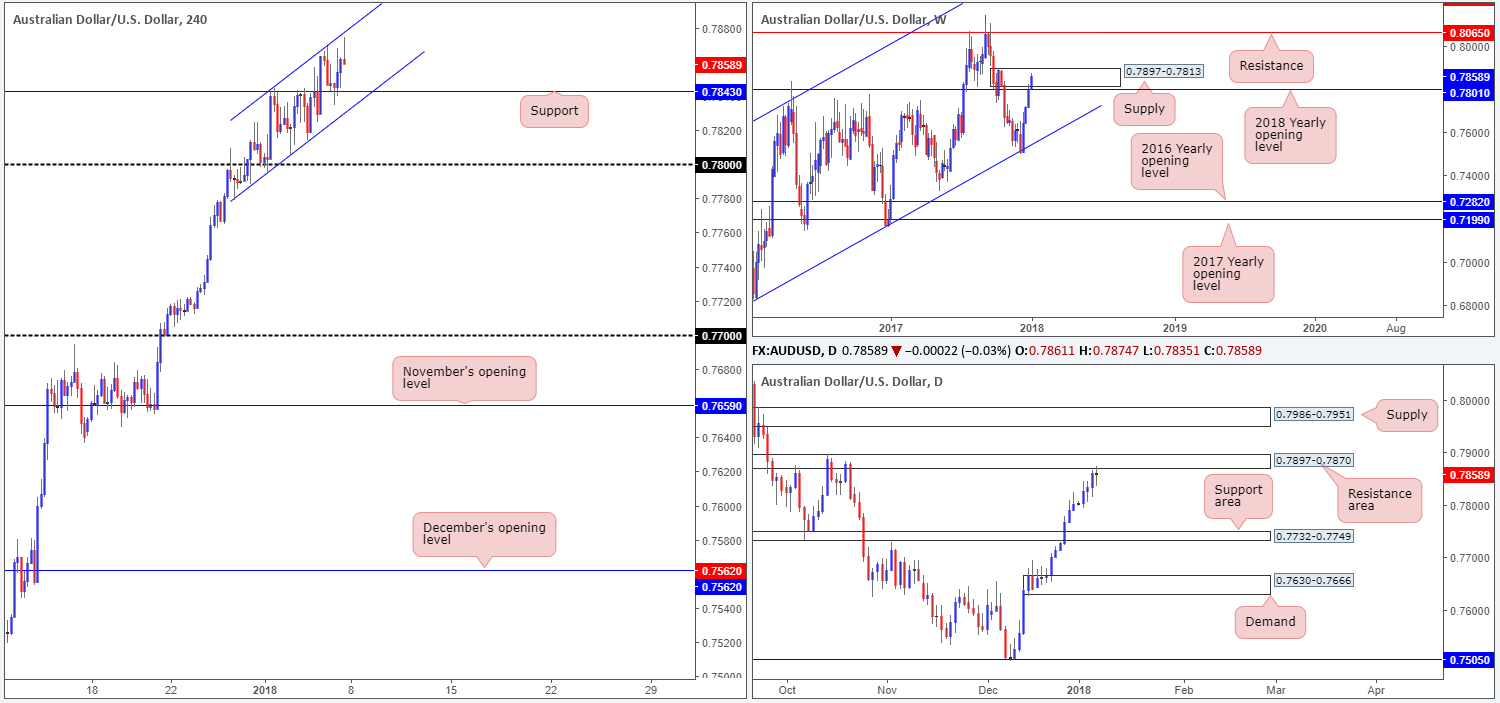
The first week of 2018 has been a productive one for the commodity currency, as price extends December’s gains. The Aussie dollar managed to climb higher last week, despite the pair ending the year closing around the underside of a weekly supply zone penciled in at 0.7897-0.7813. In the event that the bulls continue to push, a break of this area could lead to price challenging the weekly resistance level drawn from 0.8065.
A closer look at price action on the daily timeframe reveals that the unit concluded the week touching gloves with a daily resistance area seen at 0.7897-0.7870. Not only is this zone positioned within the upper limits of the weekly supply zone highlighted above, we can also see that Friday’s trading chalked up a clear cut daily indecision candle.
Over on the H4 timeframe, it can be clearly seen that after the AUD found support above the 0.78 handle at the beginning of the week, the pair has been compressing within an ascending H4 channel (0.7778/0.7842). Friday’s dismal US job’s report saw an immediate spike to highs of 0.7868 after finding support around the 0.7843 neighborhood. Following a small pullback, the day ended printing a nice-looking bearish H4 selling wick, which missed the H4 channel resistance by a few pips.
Market direction:
Given the H4 channel resistance in view, along with the current weekly supply and daily resistance area, a pullback could be on the cards this week. However, selling at current prices would entail shorting into H4 support mentioned above at 0.7843 and the H4 channel support. For that reason, waiting for a close below and retest of 0.7843 may be the better path to take. The first take-profit target can be seen at the 0.78 handle, which happens to merge with the 2018 yearly opening level seen on the weekly timeframe at 0.7801. Therefore, one should expect some buying to be seen here!
Data points to consider: FOMC member Bostic speaks at 5.40pm; FOMC member Williams speaks at 6.35pm GMT.
Areas worthy of attention:
Supports: 0.7801; 0.7843; H4 channel support; 0.78 handle.
Resistances: 0.7897-0.7813; 0.8065; 0.7897-0.7870; H4 channel resistance.


