EUR/USD:
Weekly gain/loss: -1.28%
Weekly closing price: 1.2126
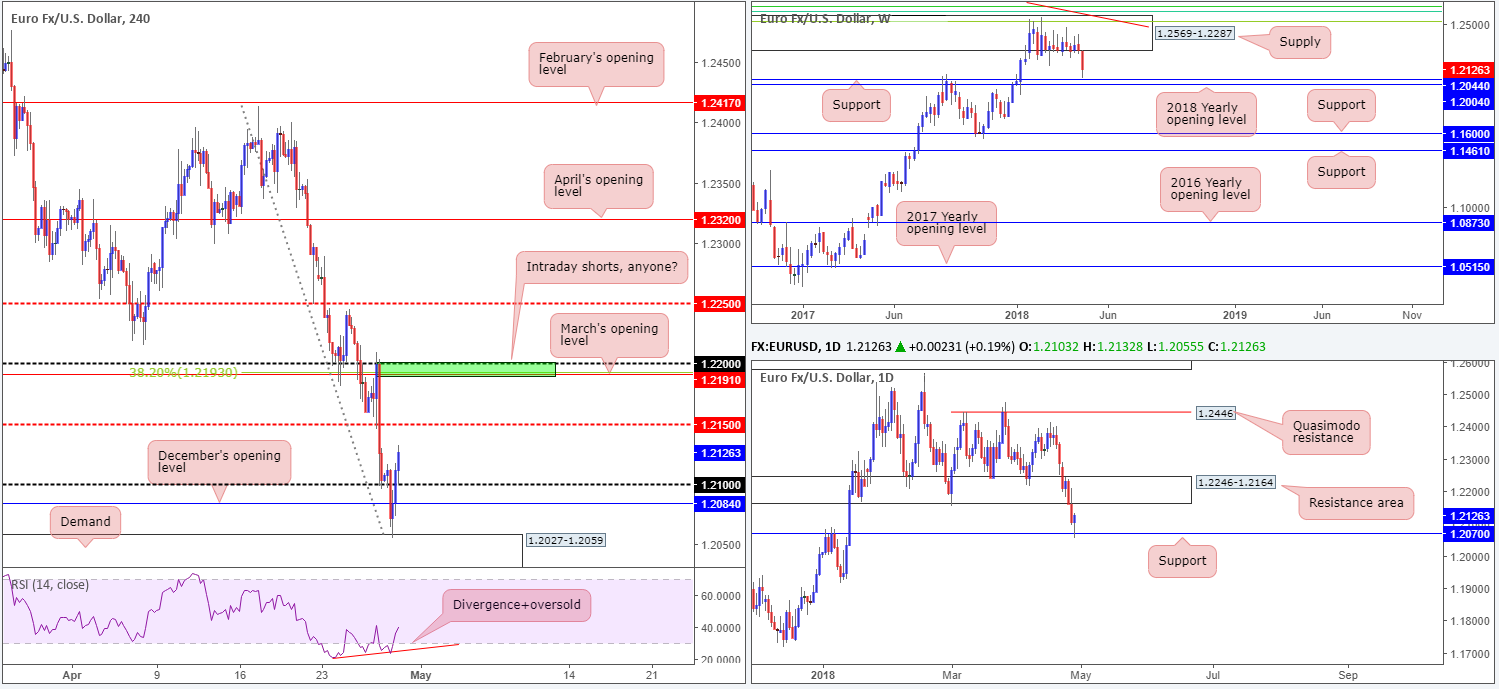
The euro shriveled against its US counterpart over the course of last week’s session. Weekly price, after three months of monotonous consolidation within the walls of a major-league weekly supply seen at 1.2569-1.2287, eventually broke to the downside. Plummeting 160 pips on the week, the unit ended the session closing within touching distance of a weekly support drawn from 1.2044, shadowed closely by the 2018 yearly opening level at 1.2004. Therefore, keep eyes on these levels this week!
In terms of daily movement, the daily support area priced in at 1.2246-1.2164 (held ground since the beginning of this year) was eliminated on Thursday (now acting resistance area). Visibly exposing daily support pegged at 1.2070, this led to a test of this level amid Friday’s trade. As you can see, it held with superb precision (likely instigated off short covering into the week’s close) in the shape of a nice-looking daily bullish pin-bar formation. Are we heading for a retest of 1.2246-1.2164 early this week?
The USD faded on Friday, despite better-than-expected US data. From a technical standpoint, this was likely due to the US dollar index recently shaking hands with a monstrous monthly resistance marked at 91.92. As a result, after the euro whipsawed through December’s opening level seen on the H4 timeframe at 1.2084 and tagged in fresh buyers off H4 demand at 1.2027-1.2059, the H4 candles recovered in strong fashion and concluded the day marginally in the green (+0.23%) above 1.21. From this point, the next upside hurdle on the radar can be seen at 1.2150: a H4 mid-level resistance that’s sited just 14 pips south of the aforementioned daily resistance barrier.
Potential trading zones:
Longer term, daily price may consolidate between its current support level and resistance area. Ultimately though, we expect weekly price will want to eventually interact with the 2018 yearly opening level mentioned above at 1.2004 (remember 1.2000 is a hugely watched psychological number in this market at the moment). As such, this remains an area of importance for potential medium-term longs.
Shorter term, on the other hand, the H4 mid-level resistance 1.2150 will likely enter the fray today/early this week, and quite possibly even March’s opening level seen above it at 1.2191, followed closely by 1.22. 1.22/1.2191 is of interest for potential intraday shorts on account of the area seen interacting with a 38.2% H4 Fib resistance value at 1.2193, and also being positioned within the boundaries of the noted daily resistance zone. However, 1.22 is likely to encourage a fakeout in order to run stops above it, so waiting for a H4 bearish close to form off this boundary is recommended before pulling the trigger!
Data points to consider today: German retail sales m/m; German prelim CPI m/m; M3 money supply y/y; US core PCE price index m/m; Chicago PMI.
GBP/USD:
Weekly gain/loss: -1.60%
Weekly closing price: 1.3775
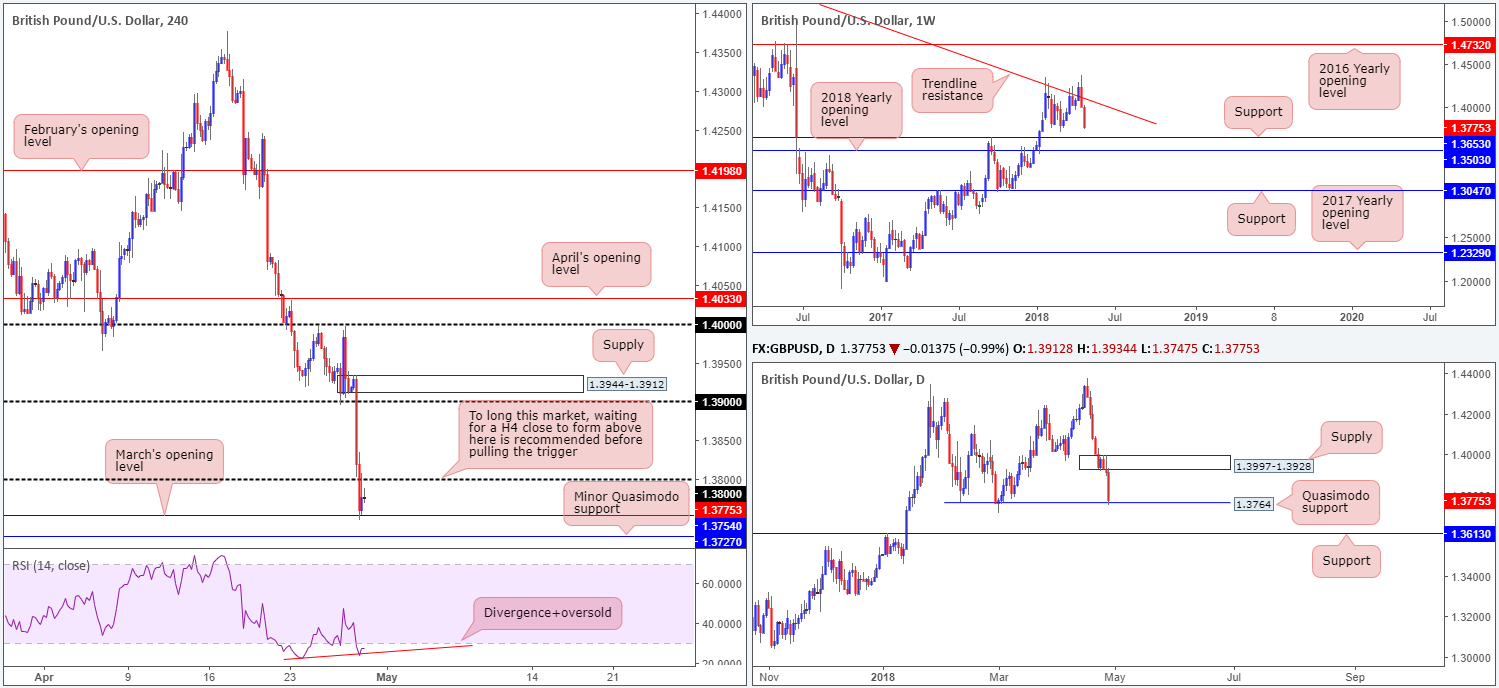
After chalking up a strong weekly bearish engulfing candle that nose-dived back beneath a long-term weekly trend line resistance (taken from the high 1.5930), the British pound, as expected, extended losses last week. With little in the way of weekly support seen until 1.3653, the currency may experience additional downside this week.
In regards to the daily timeframe, nevertheless, recent selling has brought a daily Quasimodo support level into view at 1.3764. A bounce from this vicinity could lead to the unit challenging a newly-formed daily supply zone registered at 1.3997-1.3928, whereas a break of 1.3764 has the daily support at 1.3613 to target.
The GBP was Friday’s biggest G10 loser and underperformer by some distance, largely influenced by a much bleaker-than-expected 1st look at Q1 UK growth. This put a big dent in May BoE rate hike prospects with some market measures assigning less than a 20% chance vs. 50% before the release. Stop-loss orders on the H4 timeframe were eventually tripped beyond the 1.38 level which led to a test of March’s opening line seen at 1.3754 going into the close of the week.
Potential trading zones:
Considering daily price is trading from a Quasimodo support, and H4 movement recently checked in with March’s opening level, which, as you can probably see, is also bolstered by H4 RSI divergence/oversold readings, a pop higher could be in store. The only grumble, however, is the fact that weekly price indicates lower levels may be seen.
With this in mind, the team has noted to sit tight and wait for a H4 close above 1.38 to materialize before contemplating a long position. Although this does not guarantee further bidding in this market, what it does point to is buyer intent that could ultimately lead to a retest of 1.38 as support (an ideal buy signal should it hold in the shape of a H4 bullish close) and a move being seen up to 1.39.
Data points to consider today: US core PCE price index m/m; Chicago PMI.
AUD/USD:
Weekly gain/loss: -1.20%
Weekly closing price: 0.7580
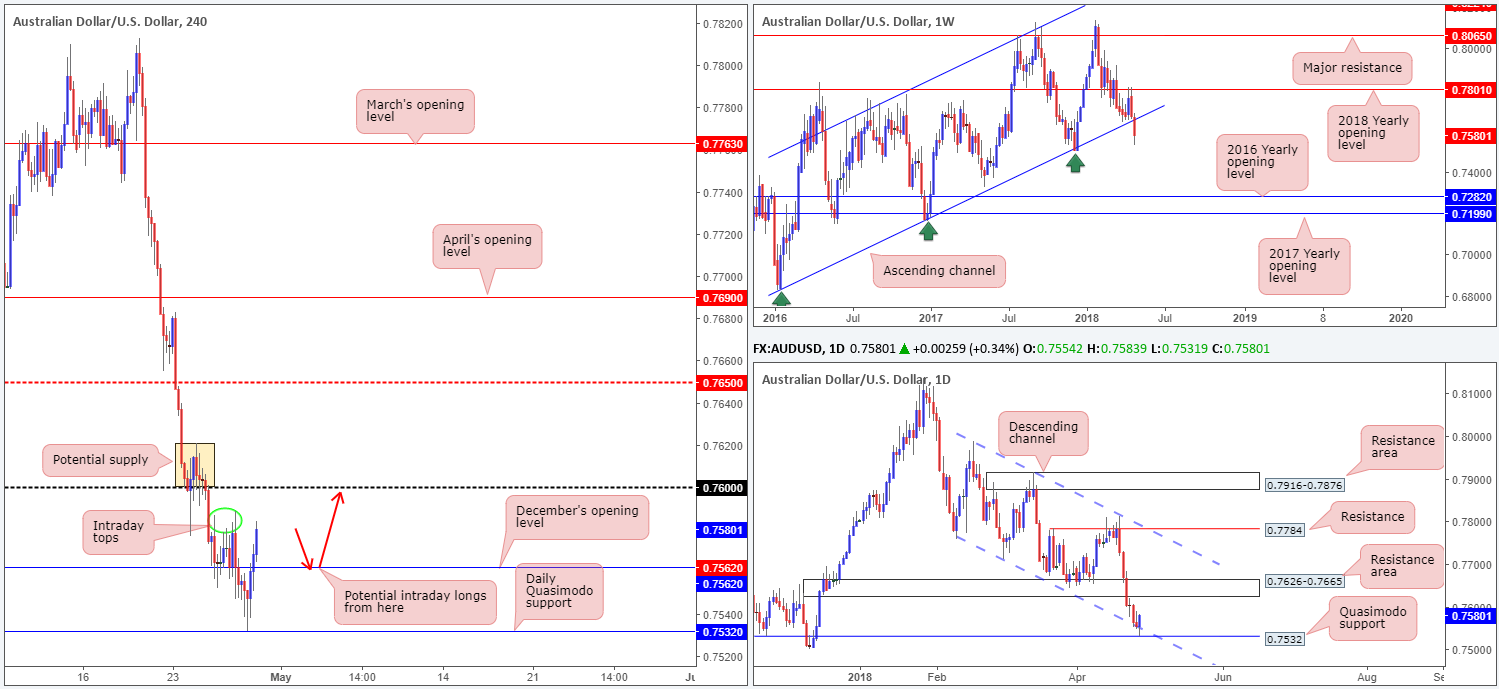
Following a retest off the 2018 yearly opening level seen on the weekly timeframe at 0.7801 two weeks back, the commodity currency continued to press lower last week and broke out of a long-term weekly ascending channel formation (taken from the low 0.6827). A breach of the weekly low 0.7502 would, as far as we can see, likely trigger further downside on this scale.
The daily demand area at 0.7626-0.7665 failed to hold ground on Monday, breaking lower in strong form. This clearly exposed a daily channel support drawn in from the low 0.7758, sited just ahead of a daily Quasimodo support at 0.7532. For those who read our reports regularly, you may recall that the team highlighted a possible fakeout below the current daily channel support into orders surrounding the noted daily Quasimodo support. As you can see, this played out perfectly, with the next upside objective not in play until we interact with the recently breached daily demand (now acting resistance area).
As is evident from the H4 timeframe, the daily Quasimodo mentioned above at 0.7532 reacted to the pip. Well done to any of our readers who took advantage of this move, which despite a round of upbeat US data hitting the wires, the pair ended Friday’s session strongly above December’s opening level at 0.7562. Apart from H4 intraday tops seen circled in green around 0.7580ish, there’s not much stopping the piece from reaching 0.76 today, which supports a rather robust area of H4 supply shaded in orange at 0.7620/0.7598 (positioned just south of the aforementioned daily resistance area).
Potential trading zones:
A retest of December’s opening level at 0.7562 as support (as per red arrows) could be an option for intraday longs today. Remember, though, upside may struggle around 0.76 and will also likely find it difficult to overcome the nearby noted daily resistance area. Another point worth noting is that by entering long from 0.7562 you would also effectively be going up against directional flow on the weekly timeframe. Therefore trade with caution.
Data points to consider today: RBA Gov. Lowe speaks; Chinese manufacturing PMI; Chinese non-manufacturing PMI; US core PCE price index m/m; Chicago PMI.
USD/JPY:
Weekly gain/loss: +1.28%
Weekly closing price: 109.02
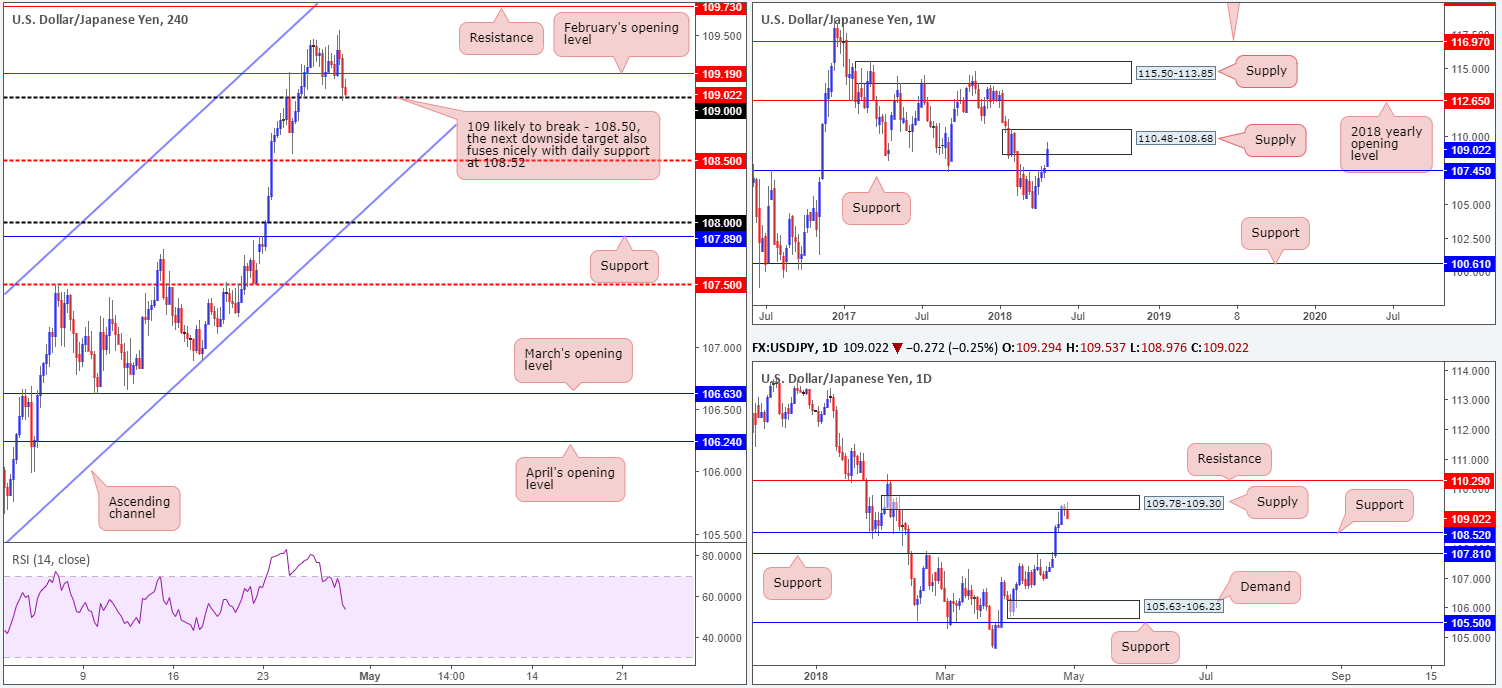
The US dollar advanced against its Japanese counterpart for a fifth consecutive session last week, resulting in weekly price journeying into a weekly supply zone penciled in at 110.48-108.68. A rejection off this area will likely position the unit ahead of weekly support at 107.45, while a break to the upside shines the spotlight on the 2018 yearly opening level seen at 112.65.
Encapsulated within the aforementioned weekly supply is a daily supply area seen at 109.78-109.30, which, as you can see, responded favorably in the later stages of last week. Continued selling from this point will bring daily support at 108.52 into view, which is shadowed closely by another layer of daily support penciled in at 107.81.
A quick recap of Friday’s movement on the H4 timeframe shows that the pair faded the US-GDP led spike to highs of 105.54, swiftly dropping through bids sited at February’s opening level drawn from 109.19 and testing 109 into the close. Clearing 109 would be a strong indication that intraday players want the H4 mid-level support at 108.50 (happens to fuse beautifully with daily support highlighted above at 108.52).
Potential trading zones:
Having seen the bigger picture, we feel 109 is likely in line for the chop. As mentioned above, the next downside target falls in around 108.50ish which does not leave a lot of wiggle room. With that being the case, assuming we already have a H4 close beneath 109, one could simply drill down to the lower timeframes and look to short 109 on a retest, confirmed in the shape of a full or near-full-bodied bearish rotation candle. That way, the stop-loss distance will drastically reduce and thus provide a better risk/reward scenario down to 108.50.
Data points to consider today: US core PCE price index m/m; Chicago PMI; Japanese banks will be closed in observance of Showa Day.
USD/CAD:
Weekly gain/loss: +0.56%
Weekly closing price: 1.2827
Following a stronger-than-expected rebound off the 2018 yearly opening level at 1.2579 two weeks ago, the pair extended gains and engaged with a weekly supply zone plotted at 1.2939-1.2815 last week. In the event of a break higher, buyers would immediately face potential selling pressure from a weekly resistance zone seen at 1.3006-1.3115.
In conjunction with weekly flow, daily price crossed swords with a daily supply zone at 1.2939-1.2882 on Wednesday in the shape of a bearish pin-bar formation. While price has yet to breach the low from Wednesday’s move, Friday’s action closed in the shape of a near-full-bodied bearish candle which is likely to encourage sellers into the market today/during the week.
For those who read Friday’s report you may remember the team underlining a possible short off of 1.29/1.2894 (round number/April’s opening level) on the H4 timeframe. As is shown on the chart, price penciled in a near-full-bodied H4 bear candle off 1.29/1.2894 and extended lower, closing the day marginally beneath March’s opening level at 1.2835 and exposing 1.28. Well done to any of our readers who managed to take advantage of this move! Partial profits should already have been locked in and risk reduced to breakeven.
Potential trading zones:
Apart from our recent announcement of 1.29/1.2894, we do not see much else to hang our hat on going forward.
Although we know price is likely to continue pressing lower thanks to higher-timeframe structure, sell zones on the H4 timeframe are limited at the moment. Those who remain short from the 1.29 region, however, should expect possible buying activity to materialize from 1.28, and also from the fresh H4 demand seen below it at 1.2749-1.2770.
Data points to consider today: US core PCE price index m/m; Chicago PMI.
USD/CHF:
Weekly gain/loss: +1.34%
Weekly closing price: 0.9877
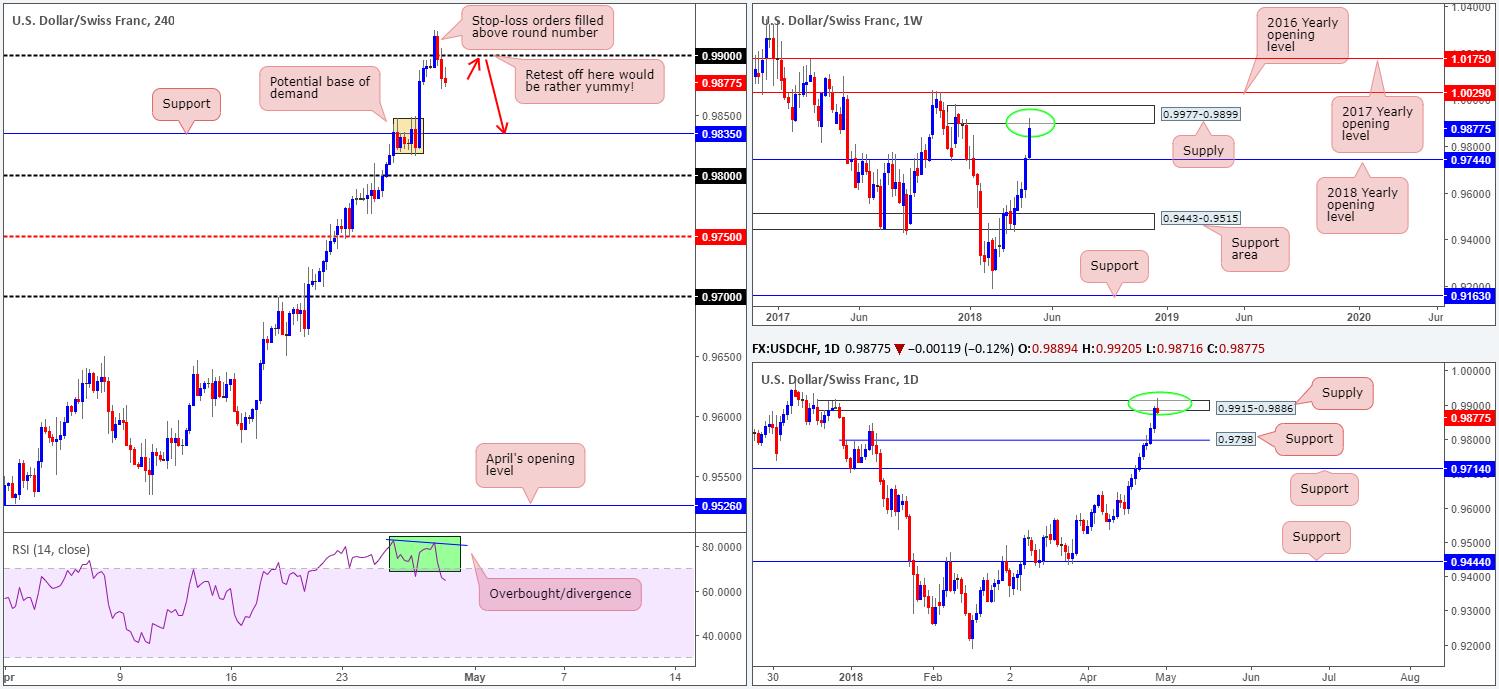
The US dollar outperformed against its Swiss counterpart throughout the course of last week’s segment, after marginally clearing the 2018 yearly opening level seen on the weekly timeframe at 0.9744 in similarly strong fashion the week before. This led to a test of weekly supply marked at 0.9977-0.9899, which, as you can see, rejected price into the close.
Turning the focus over to the daily candles, we can see that price easily cleared the daily Quasimodo resistance at 0.9798 on Wednesday (now acting support). Following this, the pair went on to test a daily supply zone printed at 0.9915-0.9886 and penciled in a daily bearish pin-bar formation. What’s also interesting here is the daily supply happens to be glued to the underside of the aforementioned weekly supply zone.
Action on the H4 timeframe is also interesting. Friday’s movement aggressively punctured the 0.99 handle in the shape of two H4 candles, while simultaneously recording overbought/divergence readings on the H4 RSI indicator.
Psychological numbers tend to attract attention and are therefore regularly run for stops i.e. a fakeout, and this is what has happened above 0.99 we believe. With sellers’ stop-loss orders likely filled above both 0.99 and the top edge of daily supply at 0.9915-0.9886 (automatically becoming buy orders), and weekly supply now in the fray, this is an opportunity for pro money to get involved, selling into the available liquidity from the retired stops.
Potential trading zones:
Ideally, a successful retest of 0.99 would be a favorable scenario for shorts, as per the red arrows. The next downside target from this angle falls in around H4 support derived at 0.9835, which also hosts a section of rather attractive demand seen shaded in orange at 0.9871/0.9848. Ultimately, though, we could see much more downside in this market, targeting 0.98s (converges with daily support coming in at 0.9798), followed then by the 2018 yearly opening level mentioned above on the weekly timeframe at 0.9744.
Data points to consider today: US core PCE price index m/m; Chicago PMI; CHF KOF economic barometer.
DOW 30:
Weekly gain/loss: -0.62%
Weekly closing price: 24311
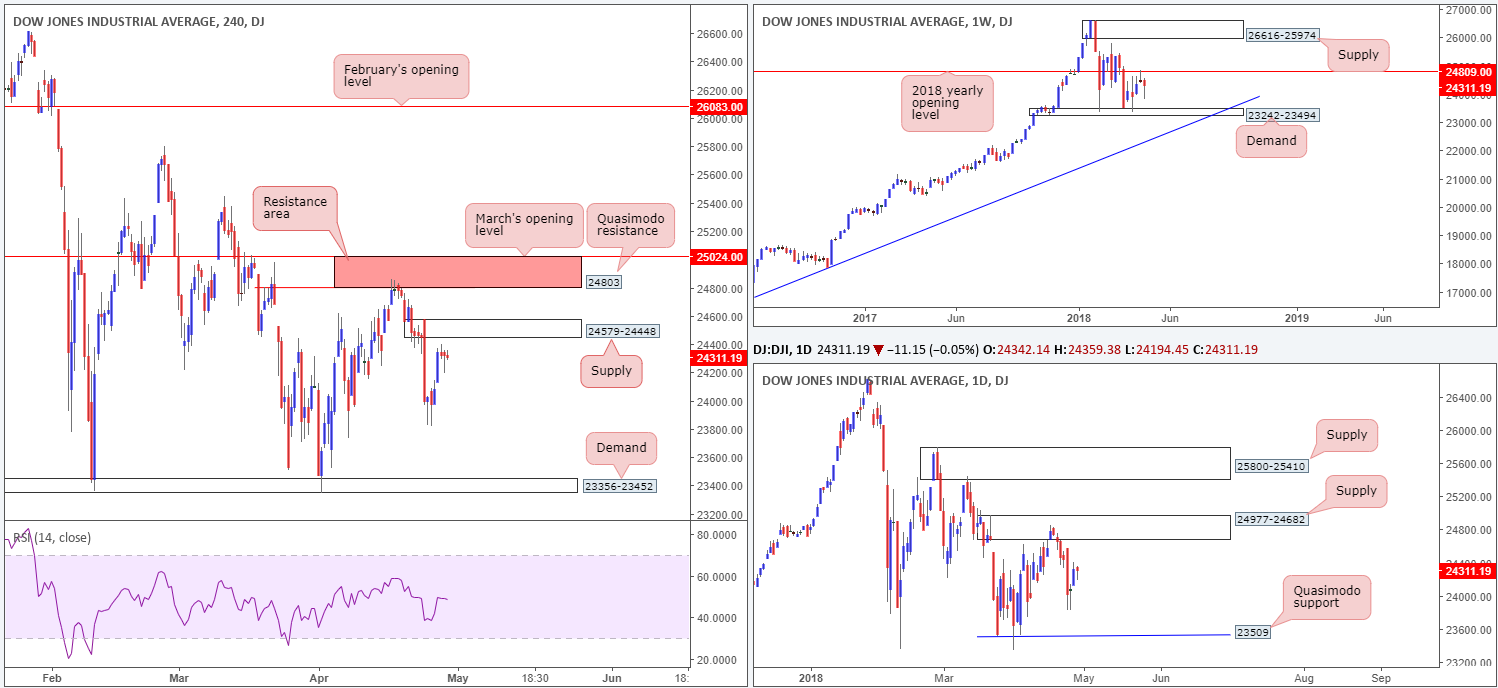
Bids/offers appear relatively even on the weekly scale, as the buyers and sellers battle for position between the 2018 yearly opening level seen at 24809 and weekly demand at 23242-23494. Beyond this range, we have eyes on weekly supply plotted at 26616-25974 and a weekly trend line support etched from the low 15450.
In similar fashion, daily price is currently sandwiched between a daily supply zone pictured at 24977-24682 (houses the 2018 yearly opening level noted above) and a daily Quasimodo support marked at 23509 (stationed just north of the aforementioned weekly demand).
Through the lens of a technical trader, latest movement has positioned the H4 candles just ahead of a H4 supply zone penciled in at 24579-24448. Traders might also want to note that above this area is a H4 resistance zone marked in red from 25024/24803 (comprised of March’s opening level and a H4 Quasimodo resistance). Also notable is the fact that the H4 resistance area has strong connections to the current daily supply and the 2018 yearly opening level.
Potential trading zones:
Having seen the confluence surrounding the current H4 resistance area, shorting from the H4 supply below it at 24579-24448 might not be the best path to take!
Therefore, traders may want to consider placing alerts for potential sell trades at the underside of the H4 resistance area. Stop-loss orders, technically speaking, would be best placed above 25024, clearing not only the top edge of daily supply but also the H4 resistance zone as well.
The initial take-profit target can be set around 24579-24448.
Data points to consider today: US core PCE price index m/m; Chicago PMI.
GOLD:
Weekly gain/loss: -0.90%
Weekly closing price: 1323.0
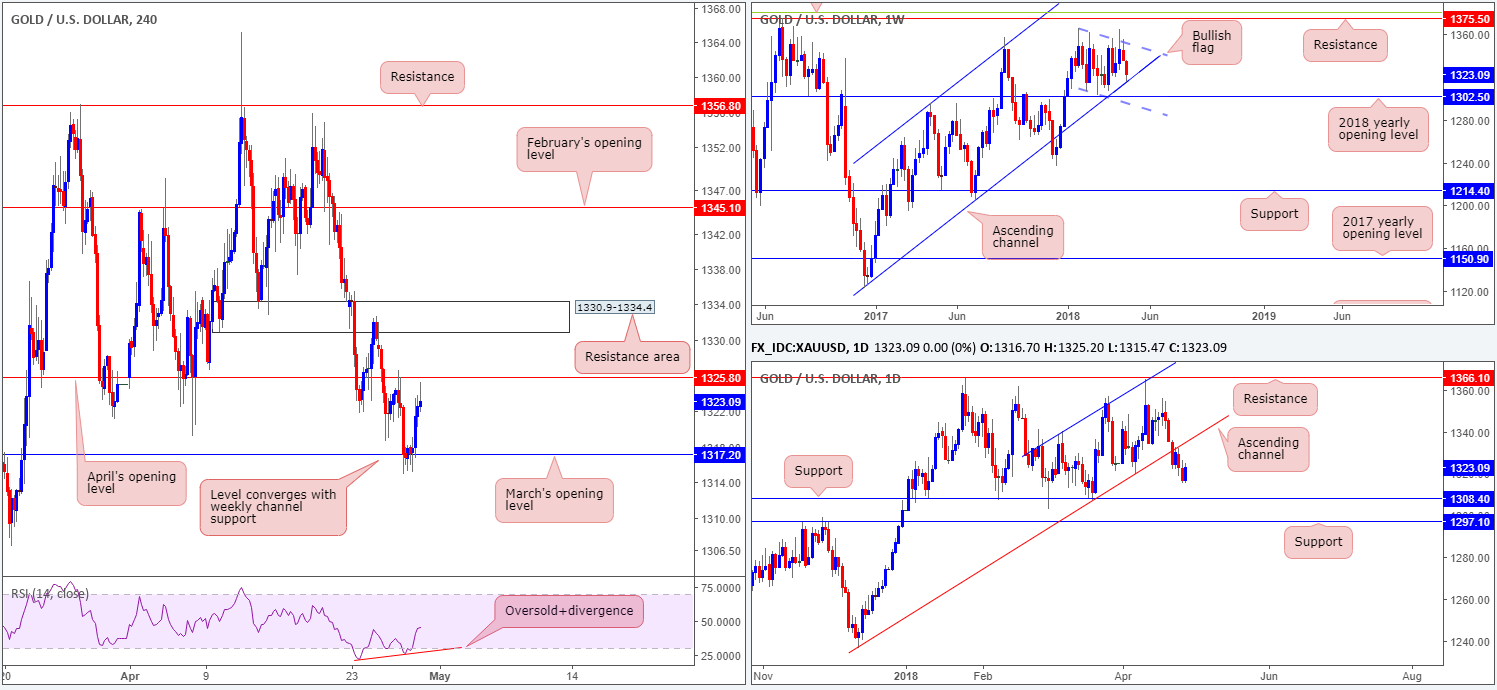
On the back of a reasonably well-bid USD last week, the price of gold sustained suffered further losses, down nearly 1%. Nevertheless, as highlighted several times throughout the week, there was nearby weekly support seen in the form of a long-term weekly channel support taken from the low 1122.8. The level was struck amid Thursday’s trade and responded with a modest rebound to the upside on Friday.
A closer look at price action on the daily timeframe, however, shows the yellow metal broke below a daily channel support taken from the low 1236.6 on Monday and was later retested as resistance during Wednesday’s segment. Further downside materialized on Thursday, breaking the April 6 low at 1319.8, and eventually met buying pressure from the aforementioned weekly channel support. As you can see on the daily scale, though, there’s room for the unit to press lower and challenge daily support at 1308.4.
As the US dollar index touched gloves with a huge monthly resistance level at 91.92 on Friday (and actually printed a daily bearish pin-bar formation), bullion held firm at March’s opening level seen on the H4 timeframe taken from 1317.2 (also converged nicely with the said weekly channel support). What was also notable from here was the H4 RSI indicator displaying oversold/divergence readings. Unfortunately H4 price failed to print a full or even near-full-bodied bull candle off 1317.2, which was needed for us to be convinced buyer intent existed here! Well done to those who caught the move, though, as it was still a noted level to keep eyes on.
Potential trading zones:
As of current price, buying based on the weekly channel support is a tricky play. Why? Well, while we agree that this is an area of significance, Friday’s rebound could have been merely a bout of short covering. In addition to this, H4 price is now trading just south of April’s opening level seen on the H4 timeframe at 1325.8, and the threat of further downside playing out on the daily timeframe is very real. Therefore, there are multiple competing themes against buying this market. It is also just as challenging on the short side of this market given that one would have to contend with selling into possible weekly bulls from the channel support.
On account of the above, neither a long nor short seems attractive at this point.
This site has been designed for informational and educational purposes only and does not constitute an offer to sell nor a solicitation of an offer to buy any products which may be referenced upon the site. The services and information provided through this site are for personal, non-commercial, educational use and display. IC Markets does not provide personal trading advice through this site and does not represent that the products or services discussed are suitable for any trader. Traders are advised not to rely on any information contained in the site in the process of making a fully informed decision.
This site may include market analysis. All ideas, opinions, and/or forecasts, expressed or implied herein, information, charts or examples contained in the lessons, are for informational and educational purposes only and should not be construed as a recommendation to invest, trade, and/or speculate in the markets. Any trades, and/or speculations made in light of the ideas, opinions, and/or forecasts, expressed or implied herein, are committed at your own risk, financial or otherwise.
The use of the site is agreement that the site is for informational and educational purposes only and does not constitute advice in any form in the furtherance of any trade or trading decisions.
The accuracy, completeness and timeliness of the information contained on this site cannot be guaranteed. IC Markets does not warranty, guarantee or make any representations, or assume any liability with regard to financial results based on the use of the information in the site.
News, views, opinions, recommendations and other information obtained from sources outside of www.icmarkets.com.au, used in this site are believed to be reliable, but we cannot guarantee their accuracy or completeness. All such information is subject to change at any time without notice. IC Markets assumes no responsibility for the content of any linked site. The fact that such links may exist does not indicate approval or endorsement of any material contained on any linked site.
IC Markets is not liable for any harm caused by the transmission, through accessing the services or information on this site, of a computer virus, or other computer code or programming device that might be used to access, delete, damage, disable, disrupt or otherwise impede in any manner, the operation of the site or of any user’s software, hardware, data or property.
