EUR/USD:
Weekly gain/loss: +0.42%
Weekly close: 1.1203
Weekly perspective:
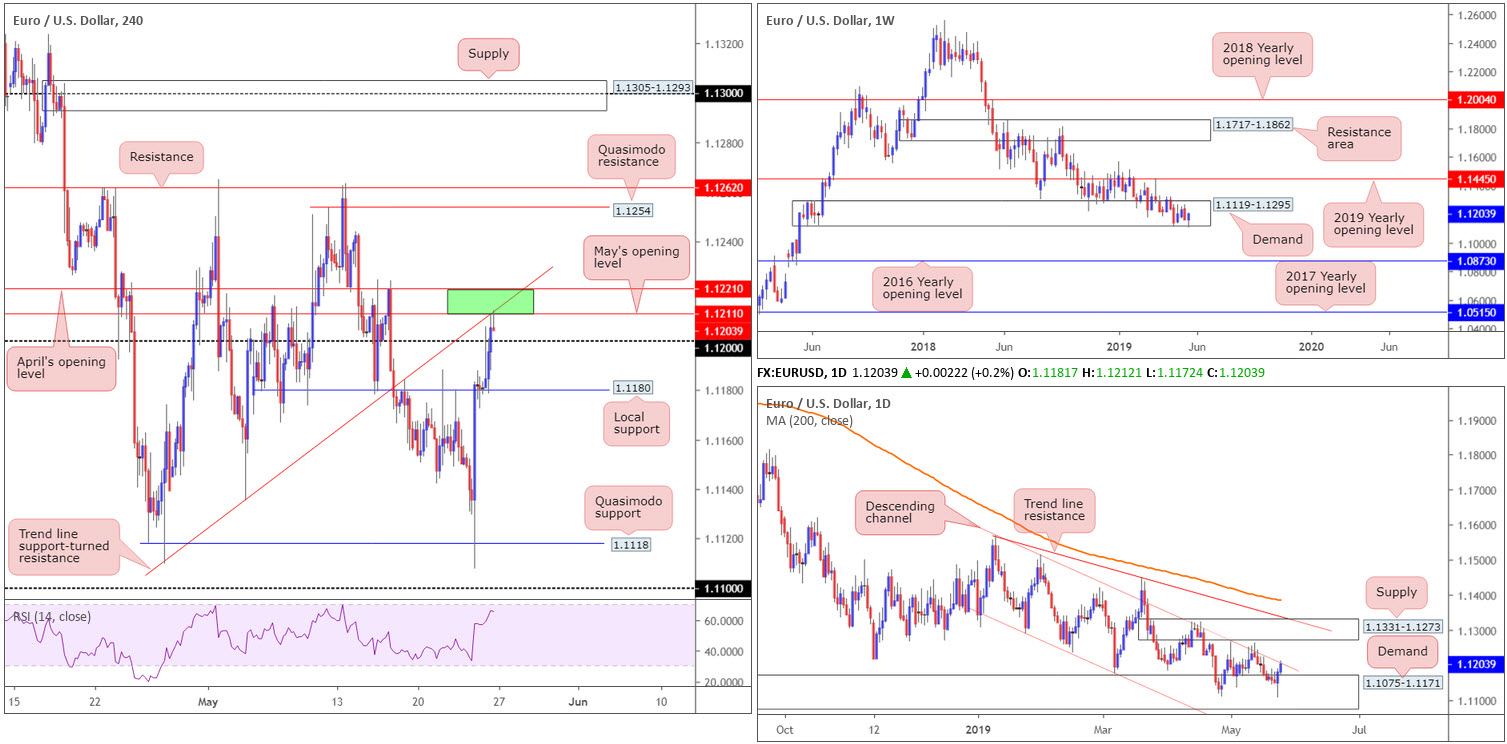
Following a borderline breach to the lower edge of a long-standing demand at 1.1119-1.1295, EUR/USD bulls went on the offensive last week. Upside from this point shows room for extension to as far north as the 2019 yearly opening level at 1.1445, whereas a move lower has the 2016 yearly opening level at 1.0873 in the firing range.
According to the overall trend facing a southerly bearing since topping in early 2018, a break of the aforesaid demand is the more likely event.
Daily perspective:
Since the beginning of May, the daily candles have been consolidating between a demand parked at 1.1075-1.1171 (glued to the underside of the current weekly demand area) and a nearby channel resistance etched from the high 1.1569.
Note the week ended with price action shaking hands with the aforesaid channel resistance. A violation of this line this week could witness the unit make a run towards supply at 1.1331-1.1273, followed by trend line resistance.
H4 perspective:
Feeble US Treasury yields along with a fading dollar index kept the euro on the winning side of the table Friday, consequently breaching 1.12 and crossing swords with May’s opening level at 1.1211 into the close. What’s also notable from a technical perspective here is trend line support-turned resistance taken from the low 1.1109, and the closing candle representing a shooting star formation. In addition to this, traders may also want to acknowledge another layer of resistance circulating close by at 1.1221 (April’s opening level) and the RSI indicator nearing its overbought line.
Areas of consideration:
The green zone marked on the H4 timeframe between 1.1221/1.1211 is likely of interest today, given Friday’s response and surrounding H4 and daily confluence (the daily channel resistance is also in motion).
While a number of traders may look to sell the H4 shooting star pattern and base entry and risk levels on its structure, they face immediate support from the 1.12 handle and the possibility of further buying within weekly demand.
Some traders might wait and see if 1.12 is engulfed, therefore clearing support until at least 1.1180 on the H4 chart. This does not leave much room to play with, though.
Another alternative (the more conservative route) would be to wait for a break of 1.1180 – the space beneath this boundary on the H4 could call for a move to H4 Quasimodo support at 1.1118. However, on the daily scale here traders almost immediately compete with the top edge of daily demand at 1.1171.
Irrespective of the trading method selected, factoring in favourable risk/reward conditions is paramount.
Today’s data points: US banks are closed in observance of Memorial Day.
GBP/USD:
Weekly gain/loss: -0.03%
Weekly close: 1.2710
Weekly perspective:
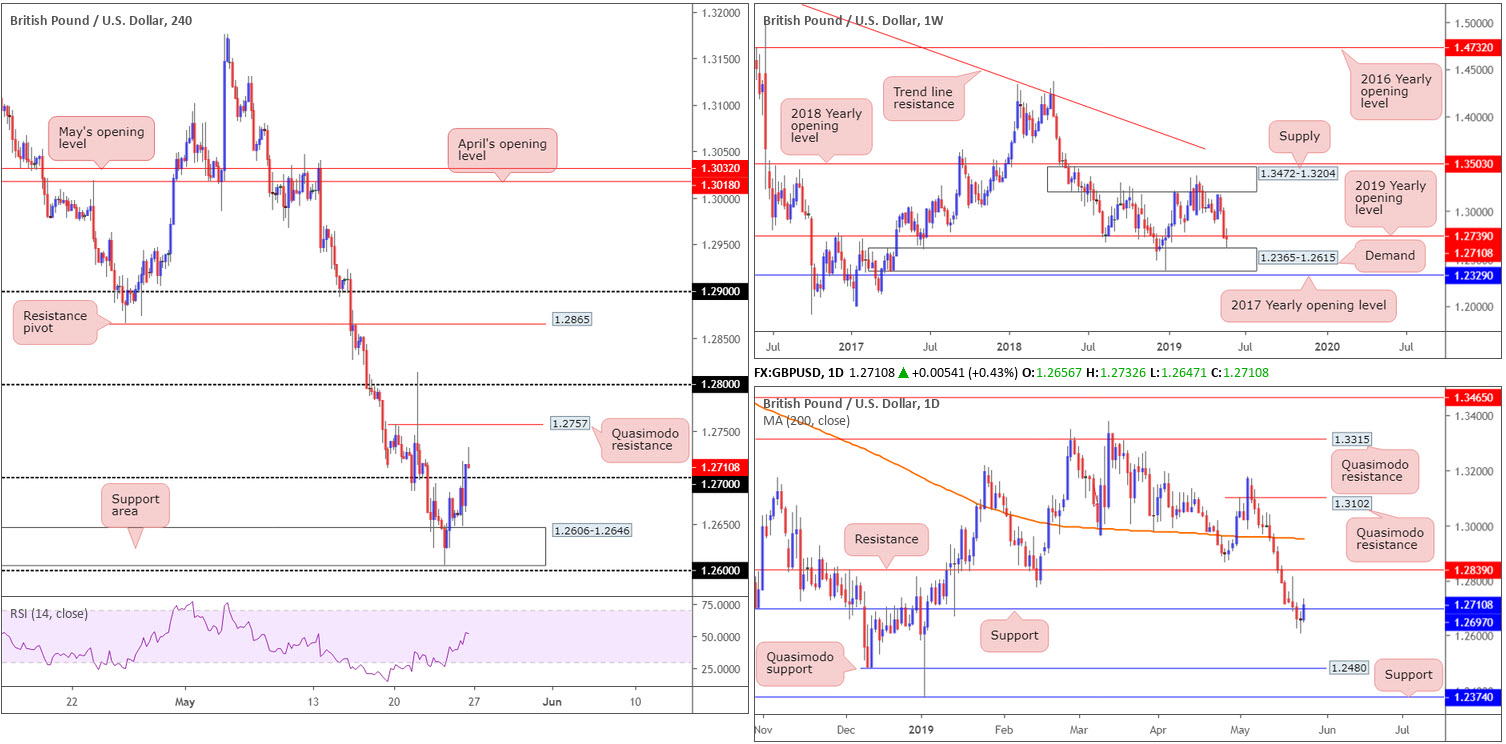
By way of an indecision candle (albeit with a slight twist to the downside), price action concluded the week sandwiched between the 2019 yearly opening level at 1.2739 and demand priced in at 1.2365-1.2615. Areas outside of this range to consider are the 2017 yearly opening level coming in at 1.2329 and supply at 1.3472-1.3204.
Daily perspective:
After encountering a floor of support Thursday at 1.2605, Friday’s movement followed through with a push above resistance at 1.2697 (now acting support), closing near its highs. Further buying from this point likely has resistance at 1.2839 on its radar. Traders may also want to note the 200-day SMA (orange) lurks above this resistance around the 1.2950ish region.
H4 perspective:
Friday’s move to the upside signals potential consolidation in the wake of two consecutive weeks of selling pressure. As expected, UK PM May conceded to backbench pressure and announced she will stand down on June 7. Still, the political/Brexit drama remains at the forefront of this market for the time being.
Technically speaking, 1.27 was overthrown to the upside Friday and finished in the shape of a shooting star pattern. 1.27 Is likely to offer the market short-term support today, while the next upside resistance target can be seen around 1.2757: a Quasimodo formation.
Areas of consideration:
With daily price exploring ground above resistance (now acting support) at 1.2697, a retest at 1.27 on the H4 scale could be something to watch for today, targeting H4 Quasimodo resistance at 1.2757, followed by the 1.28 handle.
Ultimately, a H4 close above 1.27, followed up with a retest in the shape of a bullish candlestick formation (entry and risk parameters can be adjusted according to this structure) would, according to our reading, likely entice buyers into the market. However, before reaching 1.2757 on the H4, weekly resistance at 1.2739 may hamper upside. For that reason, be sure to factor this into your risk/reward calculations should you look to buy 1.27.
Today’s data points: UK banks are closed in observance of the Spring Bank Holiday; US banks are closed in observance of Memorial Day.
AUD/USD:
Weekly gain/loss: +0.86%
Weekly close: 0.6925
Weekly perspective:
According to the market’s technical position on the weekly timeframe, price action remained within the walls of its previous weekly range last week.
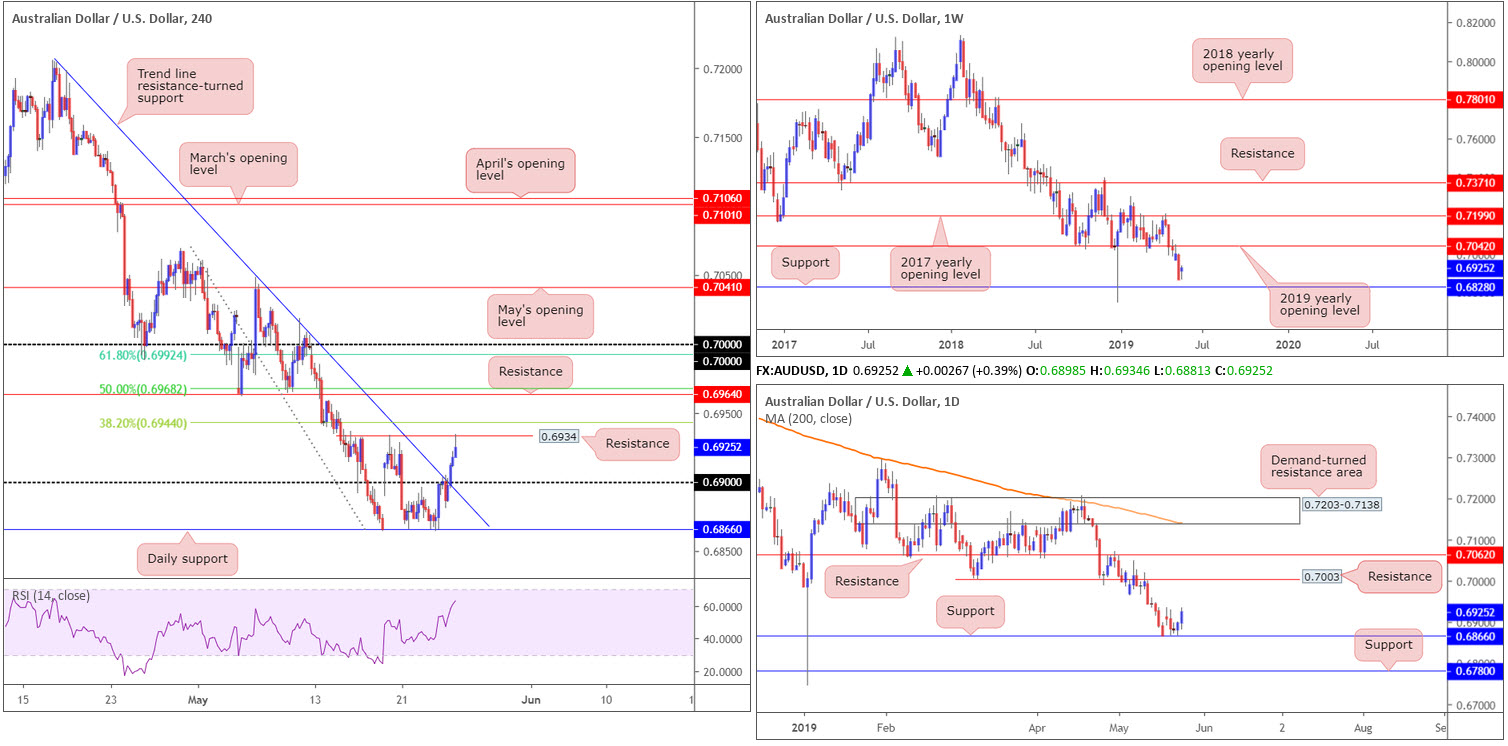
The research team, therefore, still have eyes on 0.6828 as possible support this week, and resistance by way of the 2019 yearly opening level at 0.7042.
Daily perspective:
Focus on the daily timeframe has now shifted to support establishing from the 0.6866 neighbourhood, with little in the way of resistance seen until connecting with 0.7003. Beyond the two said levels, we have another layer of support residing around 0.6780 and an additional film of resistance at 0.7062.
H4 perspective:
Benefitting on the back of broad-based USD weakness and improved market sentiment, the commodity-linked currency reclaimed 0.69 to the upside (while also breaking through a reasonably long-standing trend line resistance [0.7204]) and crossed paths with resistance at 0.6934 by the close.
Although both weekly and daily timeframes exhibit scope to press north this week, the H4 scale has a number of resistances worthy of note:
- The 38.2% Fibonacci resistance at 0.6944.
- The 50.0% resistance value at 0.6968, which happens to align with resistance at 0.6964.
- The 61.8% Fibonacci resistance value at 0.6992 – lines up nicely with the key figure 0.70. Note also we have daily resistance offering a potential ceiling close by at 0.7003.
Areas of consideration:
On account of the overall technical picture, the key figure 0.70 on the H4 timeframe is of interest this week as potential resistance. Due to its neighbouring confluence (see above), active sellers likely inhabit this region. However, waiting for additional confirmation (traders then have the option of using the selected confirmation technique to structure entry/risk levels) is recommended before pulling the trigger, since there’s a chance weekly action may attempt an approach towards the 2019 yearly opening level set 40 points above 0.70 at 0.7042.
Shorter-term traders, nonetheless, may find use in the 0.69 handle as support, owing to the clear run north visible on the bigger picture. Traders interested in 0.69 as a buy are advised not to overlook the H4 resistances. In fact, the levels can be used to trail market action towards 0.70. Also, it is advisable to wait and see how H4 action behaves off 0.69 before entering long as round numbers are prone to fakeouts (a H4 or H1 bullish candlestick formation would likely suffice).
Today’s data points: US banks are closed in observance of Memorial Day.
USD/JPY:
Weekly gain/loss: -0.71%
Weekly close: 109.27
Weekly perspective:
Despite prior action chalking up a reasonably attractive hammer pattern off the 2019 yearly opening level at 109.68, the USD/JPY struggled to make much headway last week and concluded exploring waters beneath 109.68. Assuming sellers remain in the driving seat, the next area of interest on this scale forms at support fixed from 108.13.
Daily perspective:
In terms of daily flow, price action appears poised to approach the 109.01 May 13 low, shadowed by a particularly interesting area of demand at 107.98-108.59. To the upside, nevertheless, traders may be interested in the trend line support-turned resistance (taken from the low 107.77) and merging 200-day SMA (orange). That is, of course, assuming the unit can overthrow last week’s high 110.67.
H4 perspective:
Having seen the Dow Jones Industrial Average consolidate gains Friday, and the US dollar index continue to discover fresh downside beneath 98.00, the Japanese yen gained momentum against the US dollar. With 110 now a distant memory on the H4 timeframe, the next calling falls in around the 109 handle. It also might interest indicator-based traders the RSI is seen within striking distance of its oversold value.
Areas of consideration:
109 based on the H4 timeframe may offer traders a floor to buy from this week, supported by RSI oversold conditions and the 109.01 May 13 low mentioned above on the daily timeframe. However, with a daily support area at 107.98-108.59 likely acting as a magnet for traders on that timeframe, which holds weekly support at 108.13 within (the next downside target on the weekly timeframe), 109 is potentially a fragile support.
Shorts beneath 109, therefore, are certainly an option worth exploring should we travel this far south, targeting the top edge of the daily support area at 108.59 as the initial port of call. As always, though, a retest of the broken level is considered the higher-probability move, given fakeouts are common around psychological numbers.
Aside from the above, the research team sees limited technical structure to base high-probability setups from at this time.
Today’s data points: US banks are closed in observance of Memorial Day; BoJ Gov. Kuroda Speaks.
USD/CAD:
Outlook unchanged.
Weekly gain/loss: -0.16%
Weekly close: 1.3441
Weekly perspective:
Although longer-term flows broke out above the 2017 yearly opening level at 1.3434, so far price action has failed to generate much follow-through momentum. Areas outside of this level to be aware of remain around the 2018 yearly high of 1.3664, and a trend line support etched from the low 1.2247.
Daily perspective:
Daily action, similar to the weekly timeframe, has experienced limited change over the past month or so. Price action shows the daily candles continue to feed off support drawn from the top edge of a pennant pattern (1.3467). Although the traditional price target (calculated by taking the distance from the beginning of the preceding move and adding it to the breakout price) remains on the chart at 1.3768 (black arrows), the next upside target from a structural standpoint falls in around resistance at 1.3645.
H4 perspective:
Overall, the H4 candles, since the latter part of April, have been busy carving out a 100-point+ range between May’s opening level at 1.3393/1.34 and the round number 1.35.
Friday witnessed the USD/CAD market continue to extend lower from 1.35, largely on the back of an eroding dollar (DXY) and WTI printing a mild recovery (CAD positive). Snapping two consecutive days of gains, the pair looks as if it wants to challenge the lower edge of its H4 range: May’s opening level at 1.3393/1.34 this week. Note this area also converges with the daily pennant support highlighted above.
Areas of consideration:
1.34/May’s opening level at 1.3393 is an area of interest on the H4 timeframe for possible longs this week. Not only does the base represent the lower edge of the current H4 range, it is also reinforced by the top edge of the daily pennant formation. For conservative traders, waiting for a H4 bullish candlestick to print from this region will help identify buyer intent and also serve as a structure to base entry and risk levels from.
In the event we continue to push higher, prior to testing 1.34ish, however, the market may observe a H4 close form above the 1.35 figure. Should a close higher occur, traders have the choice of either buying the breakout candle and placing stop-loss orders beneath its tail, or waiting and seeing if a retest scenario takes shape and entering on the back of the rejection candle’s structure. The next upside target on the H4 scale can be seen around 1.3570 (not seen on the screen), though according to the higher timeframes we could be heading much higher.
Today’s data points: US banks are closed in observance of Memorial Day.
USD/CHF:
Weekly gain/loss: -0.92%
Weekly close: 1.0015
Weekly perspective:
The greenback’s retreat from the 2019 high 1.0236 set towards the end of May continued last week, consequently dethroning support at 1.0110 and positioning trend line support (etched from the low 0.9187) in the firing range as the next viable support this week.
Daily perspective:
A closer analysis of price action on the daily timeframe reveals the USD/CHF rotated lower from a robust resistance zone between 1.0102/1.0140. The next area of interest to the downside can be seen around 0.9986, closely followed by the 200-day SMA (orange).
H4 perspective:
USD/CHF extended losses Friday on the back of broad-based dollar selling. The move, according to H4 action, put in a mild bottom a few points north of the key figure 1.0000 (parity), which, by and of itself, is a recognised level. Another constructive development, particularly for indicator-based traders, is the RSI entering oversold territory and producing positive divergence (blue line).
Beyond 1.0000, traders likely have their crosshairs fixed on March’s opening level at 0.9972 and April’s opening level at 0.9952.
Areas of consideration:
1.0000 is likely an area on many traders’ watchlist today. The number boasts additional backing from daily support at 0.9986 and also brings with it a confirming RSI.
In the event 1.0000 fails to offer a floor, all eyes will likely turn to the green area marked on the H4 timeframe at 0.9952/0.9972. Comprised of two monthly opening levels (see above), a merging 200-day SMA and potential convergence from the weekly trend line support underlined above, the research team feels active buyers likely reside here.
Regardless of the buy zone selected this week, traders are urged to consider waiting for additional candlestick confirmation to take shape before taking action. Not only will this help limit unnecessary losses, it’ll help identify buyer intent and provide traders a structure to work with for entry and risk levels.
Today’s data points: US banks are closed in observance of Memorial Day.
Dow Jones Industrial Average:
Outlook unchanged.
Weekly gain/loss: -0.61%
Weekly close: 25600
Weekly perspective:
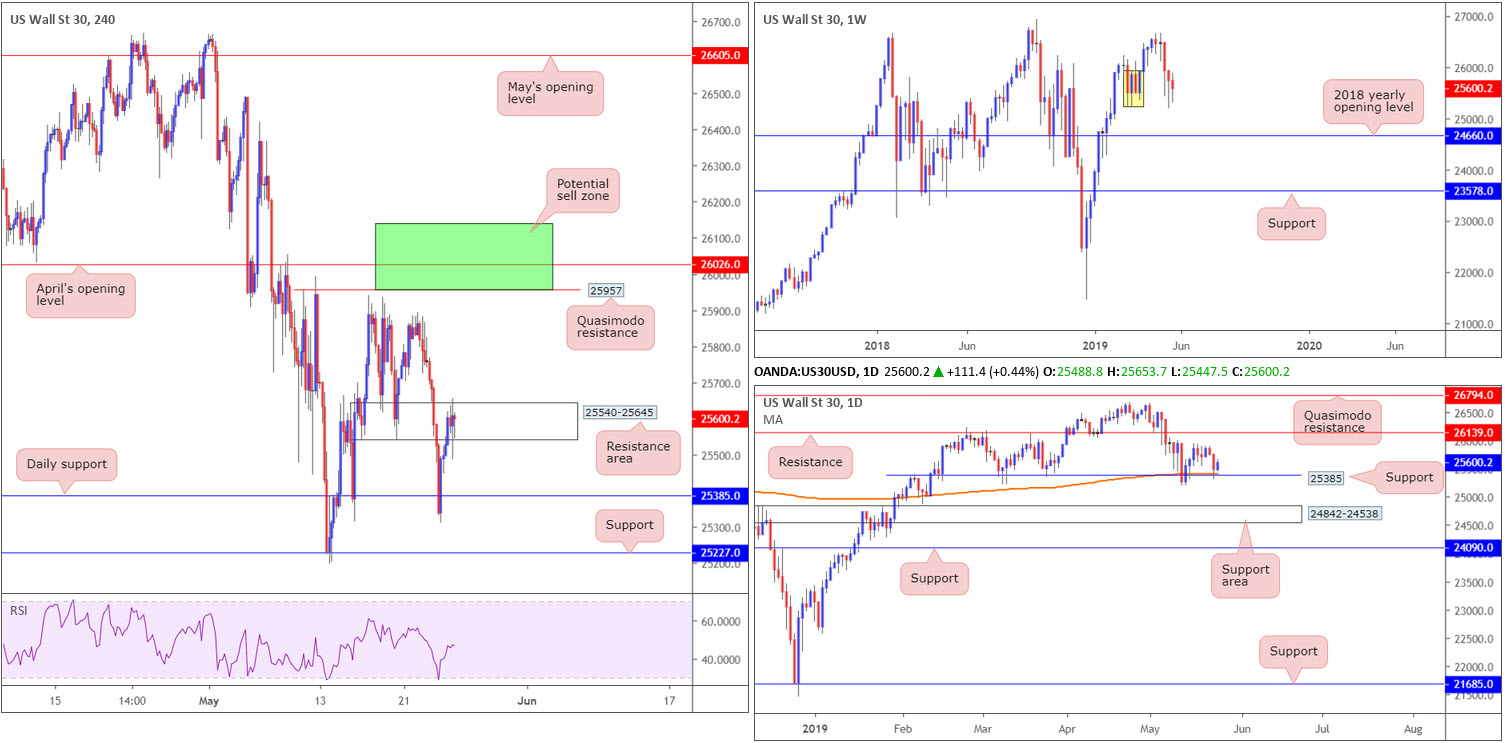
Demand marked in yellow at 25217-25927, although unlikely to be considered a strong area on this timeframe owing to limited momentum produced from the base, remains in the fold. Should this entice buyers into the market, we could be looking at a run towards the 26668 April 22 high, while a move to the downside has the 2018 yearly opening level to target at 24660.
Daily perspective:
In conjunction with weekly activity, daily movement is shaking hands with notable support at 25385, which happens to intersect with the 200-day SMA. Technically, this may provide a platform for buyers to enter the market, with the next upside point of interest falling in at resistance fixed from 26139.
Failure of 25385, nonetheless, has a support area at 24842-24538 in view.
H4 perspective:
US stocks closed higher Friday as trade concerns receded somewhat following reports US President Trump may ease restrictions against Huawei Technologies Inc. as part of a bigger trade deal with China.
The Dow Jones Industrial Average, although registering its third consecutive losing week, logged gains Friday, up 0.44%. The S&P 500 concluded Friday’s segment up 0.14% while the tech-heavy Nasdaq 100 came in lower by 0.10%.
H4 technical research reveals the bounce from the aforesaid daily support Thursday failed to generate enough oomph to overcome a resistance area at 25540-25645 Friday. Should we engulf this zone, upside will likely be confirmed at least until the candles touch gloves with H4 Quasimodo resistance at 25957.
Areas of consideration:
In light of the current technical picture, the research team notes, particularly for traders looking to buy this market, waiting for a H4 close above the current H4 resistance area is likely required before active buyers enter the fold. A H4 close above this area that’s followed up with a retest (preferably in the shape of a H4 bullish candlestick configuration – entry/risk can be determined according to this structure) would, given higher-timeframe direction, likely be enough to draw in buyers and push higher this week.
Another area the research team are particularly fond of is the green zone plotted on the H4 timeframe between 26139 (the daily resistance level) and 25957 (H4 Quasimodo resistance).
Today’s data points: US banks are closed in observance of Memorial Day.
XAU/USD (GOLD):
Weekly gain/loss: +0.59%
Weekly close: 1284.5
Weekly perspective:
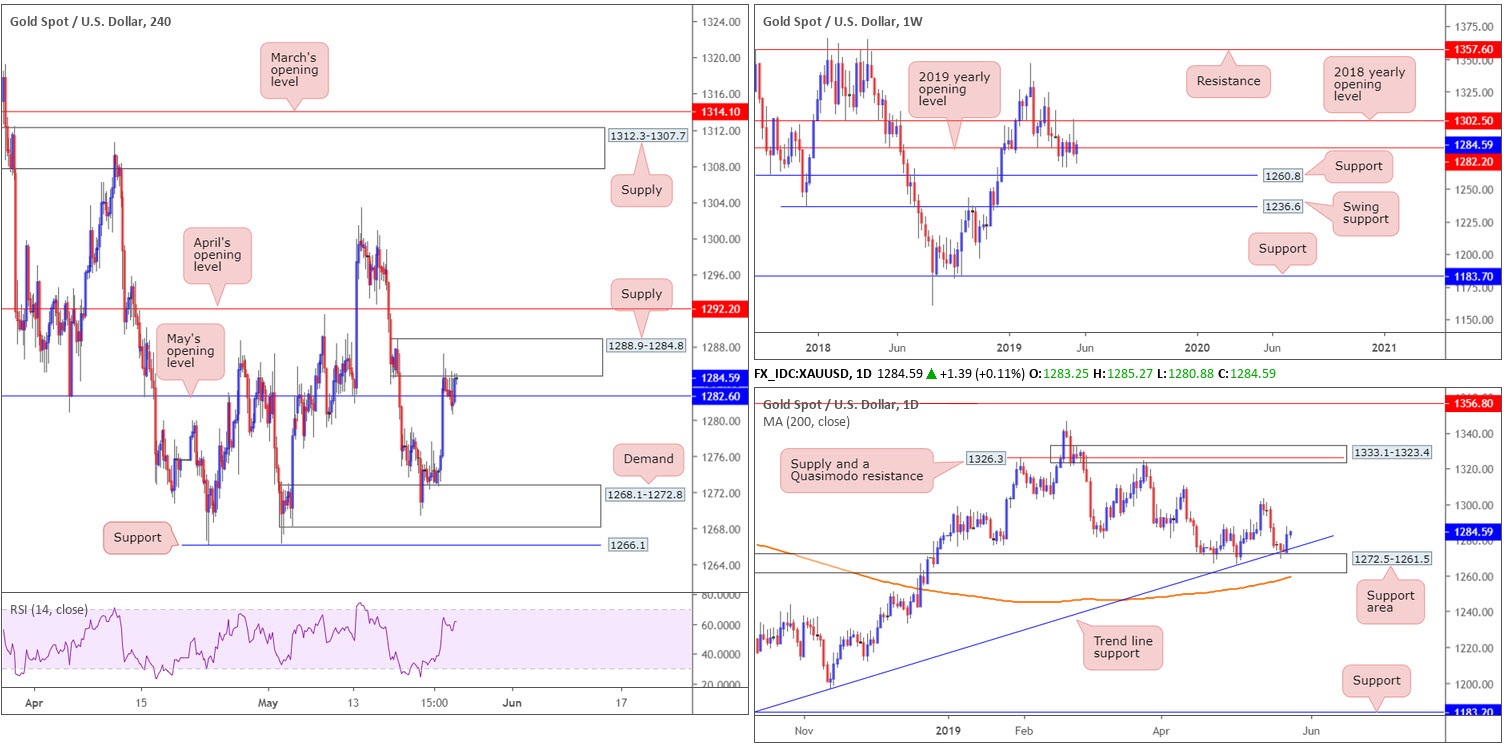
Aside from a brief spurt of energy to the 2018 yearly opening level at 1302.5, the past six weeks have been somewhat monotonous for the yellow metal, flipping between gains/losses around the 2019 yearly opening level at 1282.2. In the event we eventually explore southerly ground from here, however, support at 1260.8 is in sight, trailed closely by another layer of (swing) support at 1236.6.
Daily perspective:
The support area at 1272.5-1261.5 – boasts a reasonably solid history and merges with a trend line support taken from the low 1160.3 – held things higher last week, most notably on Thursday registering +0.79%. Continued buying from this point has the 1303.4 May 14 high as the next possible resistance.
H4 perspective:
In comparison to Thursday’s upsurge, Friday offered little in terms of movement. Contained within the prior day’s range, Friday ranged between a session high of 1285.2 and a low of 1280.8.
Sellers, as you can see, made an appearance from supply coming in at 1288.9-1284.8, as expected, though, have been unable to produce much momentum south of May’s opening level at 1282.6. With this being the case, a run through the current supply could be in order this week to April’s opening level at 1292.2.
Areas of consideration:
Although the current H4 supply boasts notable strength to the downside from its base, the technical strength behind the area likely lies behind the 2019 yearly opening level in motion on the weekly timeframe at 1282.2. Those short from this zone, however, are facing opposition from daily players attempting to extend gains from the aforesaid support area/trend line support combination.
Swing traders considering the current H4 supply as a base to short from this week might want to allow sellers to prove their worth before pulling the trigger. A decisive H4 close beneath 1282.6, followed up with a successful retest of the level, should suffice, therefore clearing the pathway south towards H4 demand plotted at 1268.1-1272.8 (seen around the top edge of the current daily support area).
The accuracy, completeness and timeliness of the information contained on this site cannot be guaranteed. IC Markets does not warranty, guarantee or make any representations, or assume any liability with regard to financial results based on the use of the information in the site.
News, views, opinions, recommendations and other information obtained from sources outside of www.icmarkets.com.au, used in this site are believed to be reliable, but we cannot guarantee their accuracy or completeness. All such information is subject to change at any time without notice. IC Markets assumes no responsibility for the content of any linked site. The fact that such links may exist does not indicate approval or endorsement of any material contained on any linked site.
IC Markets is not liable for any harm caused by the transmission, through accessing the services or information on this site, of a computer virus, or other computer code or programming device that might be used to access, delete, damage, disable, disrupt or otherwise impede in any manner, the operation of the site or of any user’s software, hardware, data or property.


