DXY:
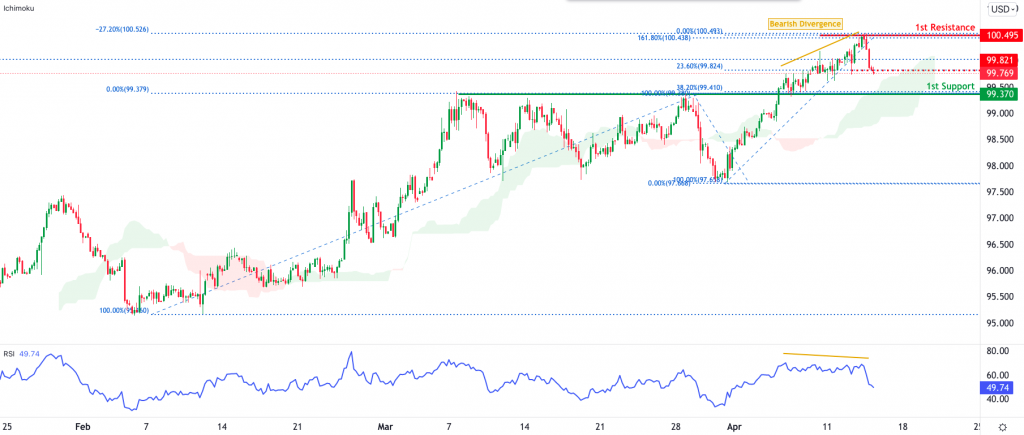
Price has reversed off major 1st resistance highlighted yesterday at 100.49. This was aided by the Fibonacci confluence area along with a strong bearish divergence. We’re seeing price break a 23.6% fibonacci retracement which is the first sign of a potential further drop to major 1st support at 99.37 which is a strong pullback support area that lines up with the Ichimoku cloud support.
Areas of consideration:
- H4 time frame, 1st resistance at 100.49
- H4 time frame, intermediate resistance at 99.82
- H4 time frame, 1st support at 99.37
XAU/USD (GOLD):
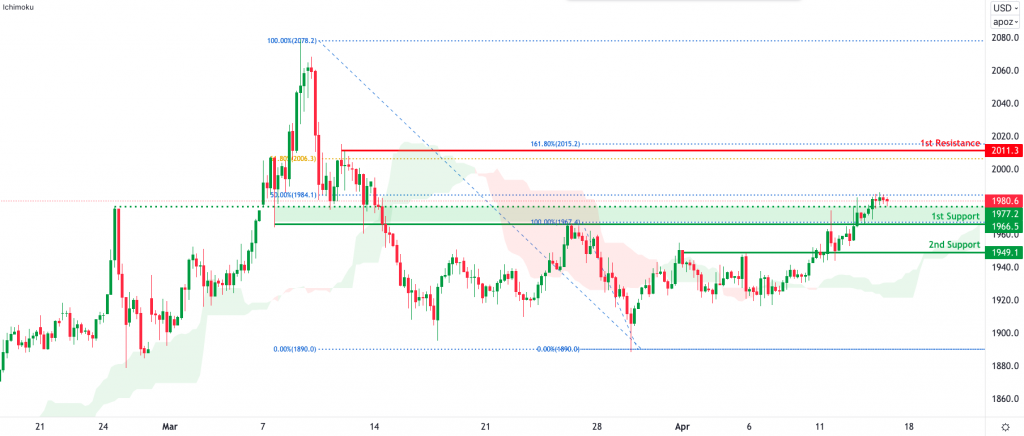
Price has broken out of the 1st resistance area turning it into a strong 1st support area above 1966. There is a risk level at 1984 which is a 50% Fibonacci retracement of the entire move – price needs to break this level to trigger a further rise up to potentially 1st resistance at 2011. It is currently aided by the bullish ichimoku cloud below it suggesting that there is bullish momentum.
Areas of consideration:
- H4 time frame, 1st Resistance at 2011.3
- H4 time frame, 1st Support at 1966.5
- H4 time frame, 2nd Support at 1949.1
GBP/USD:
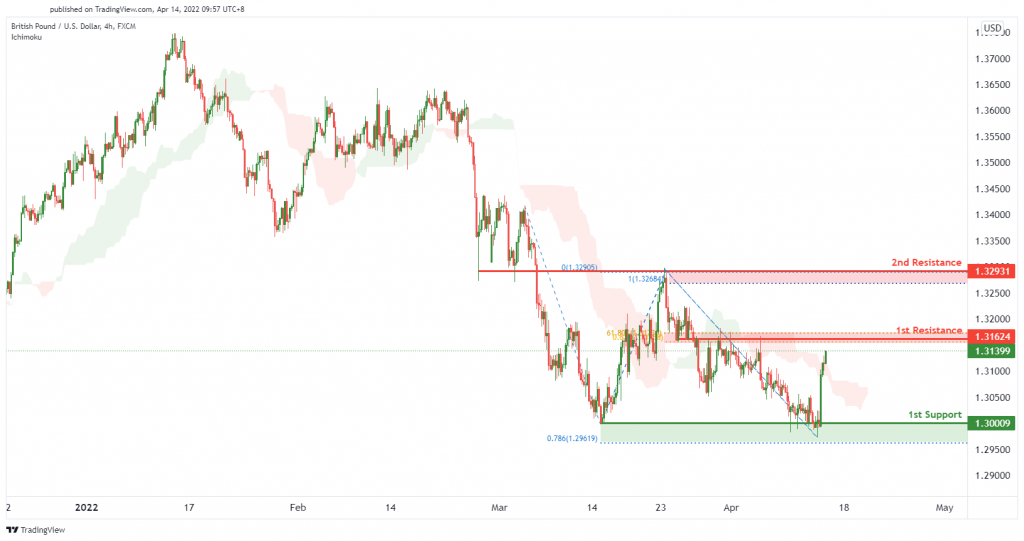
On the H4 timeframe, we expect to see a potential for bearish reversal from 1st resistance level of 1.31624 in line with and 61.8% retracement and 61.8% Fibonacci projection towards the 2nd support level of 1.30009 in line with 78.6% Fibonacci projection. Our bearish bias is supported by price trading below the Ichimoku cloud indicator.
Areas of consideration:
- H4 1st resistance at 1.31624
- H4 2nd resistance at 1.32931
- H4 1st support at 1.30009
USD/CHF:
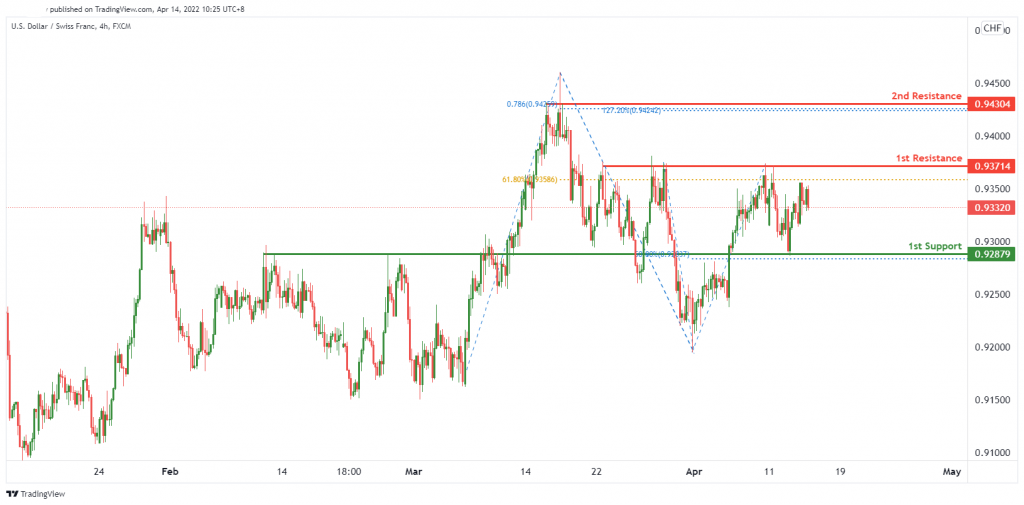
On the H4, we see the potential for bearish reversal from our 1st resistance at 0.93714 in line with 61.8% FIbonacci retracement towards our 1st support at 0.92879 which is in line with 50% Fibonacci retracement. Alternatively, price might break through the key resistance level and head towards the 2nd resistance level of 0.94304 which lines up with 78.6% Fibonacci projection and 127.2% Fibonacci extension.
Areas of consideration
- 1st support level at 0.92879
- 1st resistance level at 0.93714
- 2nd resistance level at 0.94304
EUR/USD :
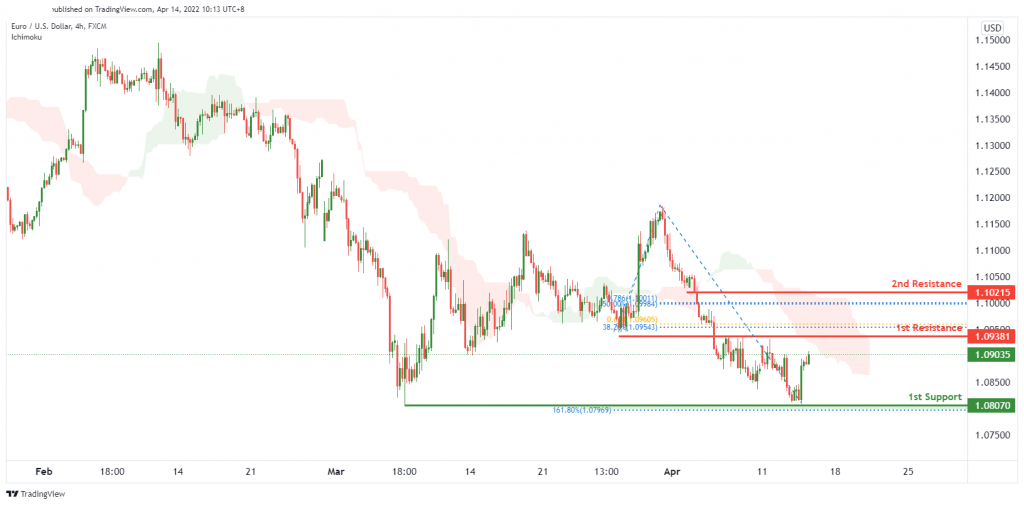
On the H4 timeframe, price is near a key pivot. We see the potential for a bearish reversal from our 1st resistance level of 1.09381 in line with 38.2% Fibonacci retracement and 61.8% Fibonacci projection towards our 1st support level of 1.08070 in line with 161.8% Fibonacci extension. Our bearish bias is supported by price trading below the Ichimoku cloud indicator.
Areas of consideration :
- H4 1st resistance at 1.09381
- H4 2nd resistance at 1.10215
- H4 1st support at 1.08070
USD/JPY:
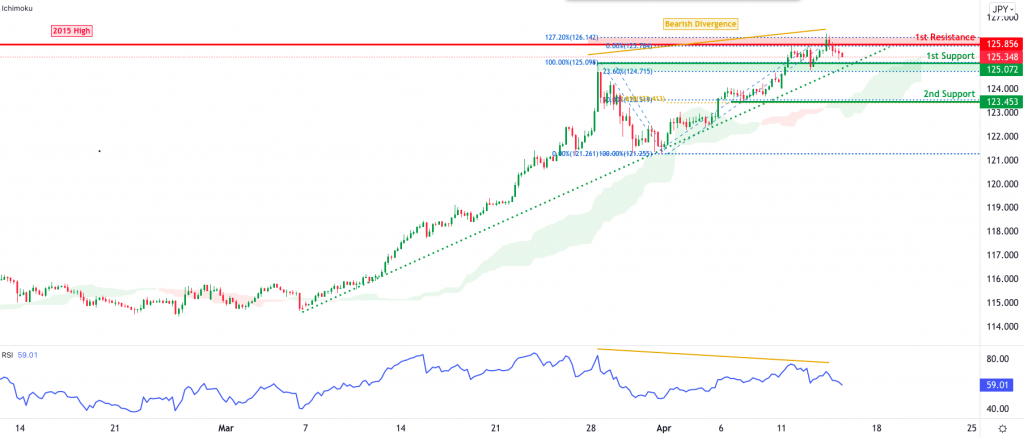
Price has reversed off 1st resistance identified at 125.85 area yesterday. However, it is approaching the ascending support and pullback support level at 125.07. Price will likely be squeezed between these 2 major levels. If price breaks the 1st support at 125.07, it’s likely to see a strong drop to 123.45 support level which is a 50% Fibonacci retracement and 61.8% Fibonacci projection. It is worth noting that there’s a strong bearish divergence against RSI suggesting that we might see a big bearish reversal.
Areas of consideration:
- H4 time frame, 1st resistance at 125.85
- H4 time frame, 1st support at 125.07
- H4 time frame, 2nd support at 123.45
AUD/USD:
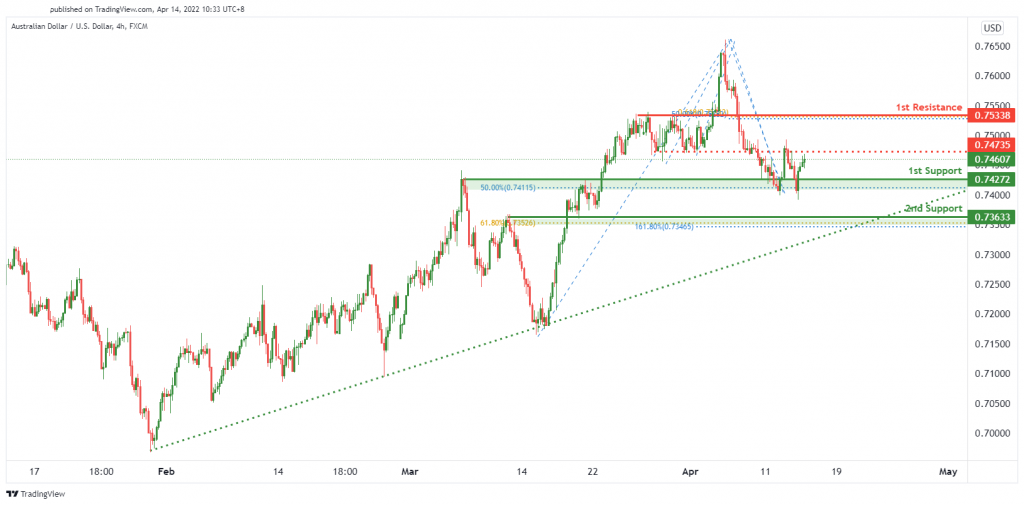
On the H4 timeframe, we see the potential for a bullish continuation from our 1st support level at 0.74272 in line with 50% Fibonacci retracement towards our 1st resistance level at 0.75338 in line with 50% Fibonacci retracement and 61.8% Fibonacci projection. Alternatively, if price break through the key support level, price might drop to to the 2nd support level of 0.73633 in line with 61.8% Fibonacci retracement and 161.8% Fibonacci extension.
Areas of consideration
- H4 1st resistance at 0.75338
- H4 1st support at 0.74272
- H4 2nd support at 0.73633
NZD/USD:
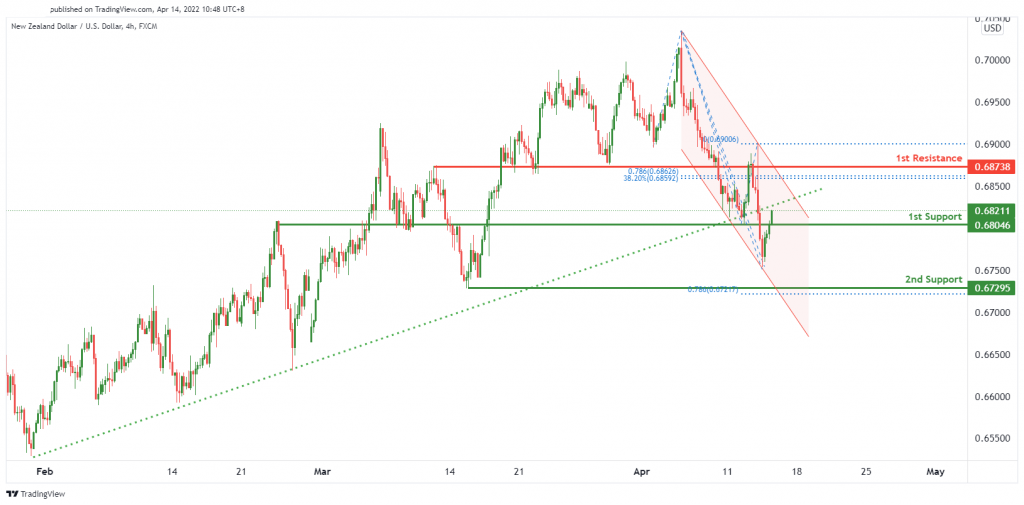
On the H4, we expect to see a potential for a bullish continuation from our 1st support of 0.68046 in line with key graphical overlap support towards our 1st resistance level at 0.69853 in line with the 78.6% Fibonacci retracement and 61.8% Fibonacci projection. Alternatively, if price breaks through the key support level, it might drop towards the 2nd support level of 0.67295 in line with 78.6% Fibonacci projection.
Areas of consideration:
- H4 time frame, 1st support at 0.68046
- 01H4 time frame, 2nd support at 0.67295
- H4 time frame, 1st resistance at 0.68738
USD/CAD:
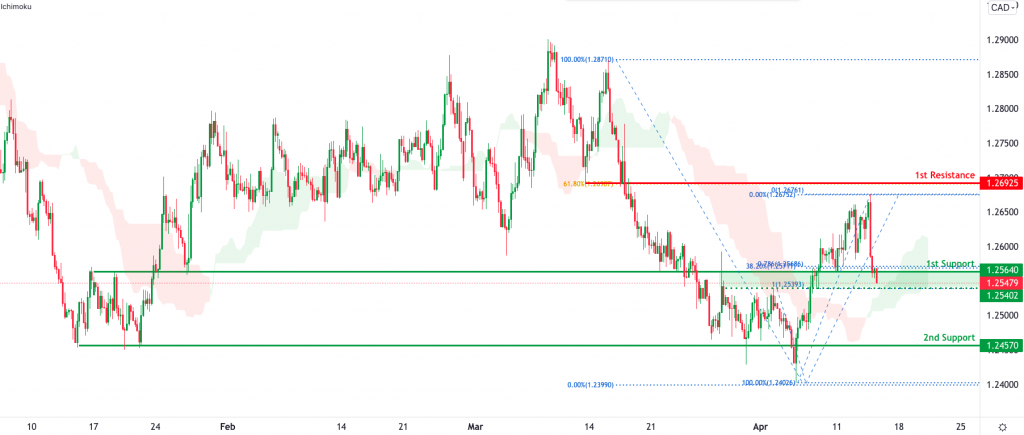
Price is testing a major 1st support area at 1.2564 and breaking this 1st support would potentially trigger a bigger move down to 2nd support at 1.2457 area which has seen prices bounce off multiple times in the pasrt. It is worth noting that there’s an Ichimoku cloud support right where price is above the 1.2540 area.
Areas of consideration:
- H4 time frame, 1st resistance at 1.2692
- H4 time frame, 1st support at 1.2564
- H4 time frame, 2nd support at 1.2457
OIL:
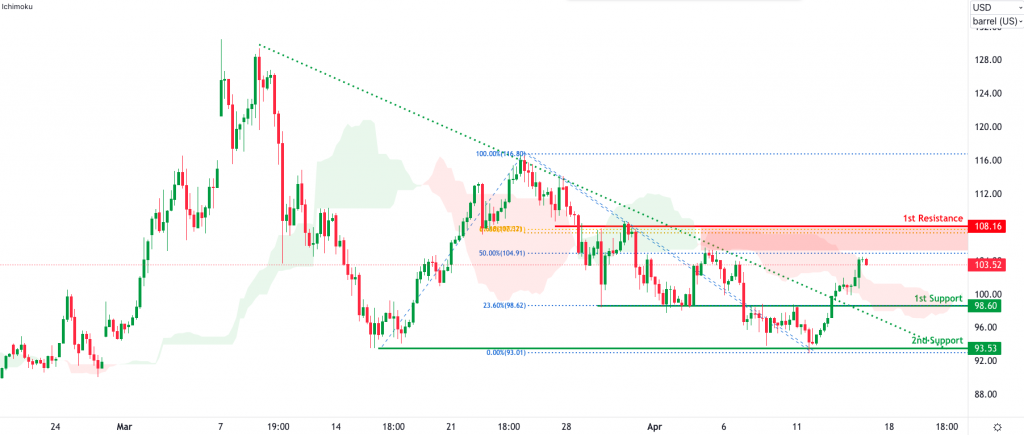
Oil has risen to the 1st resistance we highlighted yesterday. Today we’re seeing it hover slightly below the resistance area of 105 to 108 which is a 50% – 61.8% Fibonacci retracement area. It is also testing the Ichimoku cloud resistance area. Breaking above this level would suggest prices could rise to test the 108.16 level.
1st Support is down at 98.60 which is a strong overlap support level.
Areas of consideration:
- H4 time frame, 1st resistance of 108.16
- H4 time frame, 1st support of 98.60
- H4 time frame, 2nd support at 93.53
Dow Jones Industrial Average:
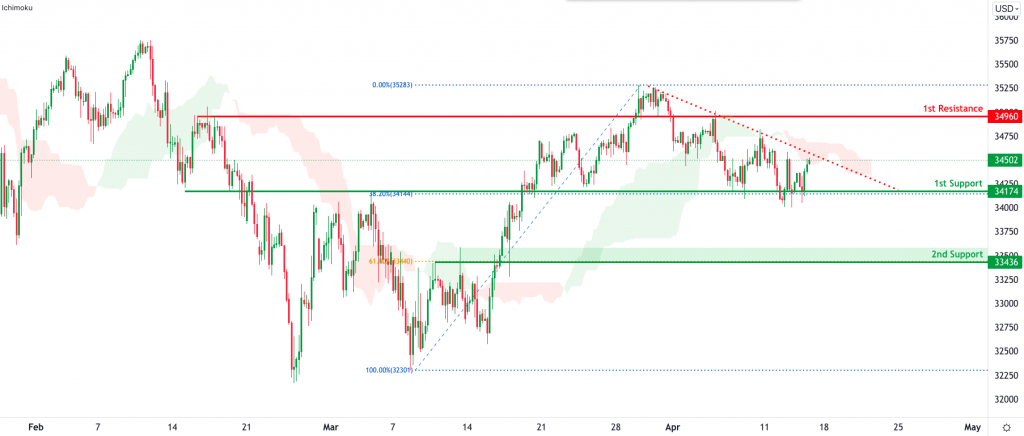
Price has bounced above the 1st support we highlighted yesterday at 34174. We can see that it is testing the descending resistance line once again and is also testing the bearish Ichimoku cloud resistance. Price is likely to be squeezed further down and a break of the 34174 area should trigger a bigger move down to 33436 level which is a pullback support along with a 61.8% Fibonacci retracement.
Areas of consideration :
- H4 time frame, 1st resistance at 34960
- H4 time frame, 1st support at 34174
- H4 time frame, 2nd support at 33436
The accuracy, completeness and timeliness of the information contained on this site cannot be guaranteed. IC Markets does not warranty, guarantee or make any representations, or assume any liability regarding financial results based on the use of the information in the site.
News, views, opinions, recommendations and other information obtained from sources outside of www.icmarkets.com.au, used in this site are believed to be reliable, but we cannot guarantee their accuracy or completeness. All such information is subject to change at any time without notice. IC Markets assumes no responsibility for the content of any linked site.
The fact that such links may exist does not indicate approval or endorsement of any material contained on any linked site. IC Markets is not liable for any harm caused by the transmission, through accessing the services or information on this site, of a computer virus, or other computer code or programming device that might be used to access, delete, damage, disable, disrupt or otherwise impede in any manner, the operation of the site or of any user’s software, hardware, data or property.
