A note on lower timeframe confirming price action…
Waiting for lower timeframe confirmation is our main tool to confirm strength within higher timeframe zones, and has really been the key to our trading success. It takes a little time to understand the subtle nuances, however, as each trade is never the same, but once you master the rhythm so to speak, you will be saved from countless unnecessary losing trades. The following is a list of what we look for:
- A break/retest of supply or demand dependent on which way you’re trading.
- A trendline break/retest.
- Buying/selling tails/wicks – essentially we look for a cluster of very obvious spikes off of lower timeframe support and resistance levels within the higher timeframe zone.
- Candlestick patterns. We tend to only stick with pin bars and engulfing bars as these have proven to be the most effective.
We search for lower timeframe confirmation between the M15 the H1 timeframes, since most of our higher-timeframe areas begin with the H4. Stops are usually placed 5-10 pips beyond confirming structures.
EUR/USD:
The value of the EUR weakened in aggressive fashion during the course of yesterday’s sessions, dropping heavily from just below our H4 sell zone (comprised of a H4 resistance line at 1.1433 and a H4 61.8% Fib resistance at 1.1418 [green circle]). This, as you can see, cleared out bids from H4 support at 1.1367 (now acting resistance) and ended with price bottoming out just ahead of the 1.13 handle.
Technically, this sell-off was expected owing to the weekly candle trading within a weekly supply area seen at 1.1533-1.1278, whilst daily action was, at the time, also flirting with the inside of a daily supply zone coming in at 1.1446-1.1369. Additionally, we can see that yesterday’s selling formed a nice-looking daily bearish engulfing candle, suggesting that the shared currency may be looking to connect with daily demand at 1.1215-1.1264 (the next downside target seen on the higher timeframes).
Our suggestions: Watch for this market to close below 1.13, since the path beyond this number looks clear down to H4 support at 1.1233, making it an ideal take-profit line (conveniently sits within the aforementioned daily demand area). Following a satisfactory close lower, our team will begin looking for price to retest 1.13 as resistance and print a lower timeframe sell signal. This could be in the form of an engulf of demand followed by a retest, a trendline break/retest or simply a collection of selling wicks around resistance. Ultimately, stops are usually placed 5-10 pips beyond confirming structures to give the trade room to breathe.
Levels to watch/live orders:
- Buys: Flat (Stop loss: N/A).
- Sells: Watch for price to consume 1.13 and look to trade any retest seen thereafter (lower timeframe confirmation required).
GBP/USD:
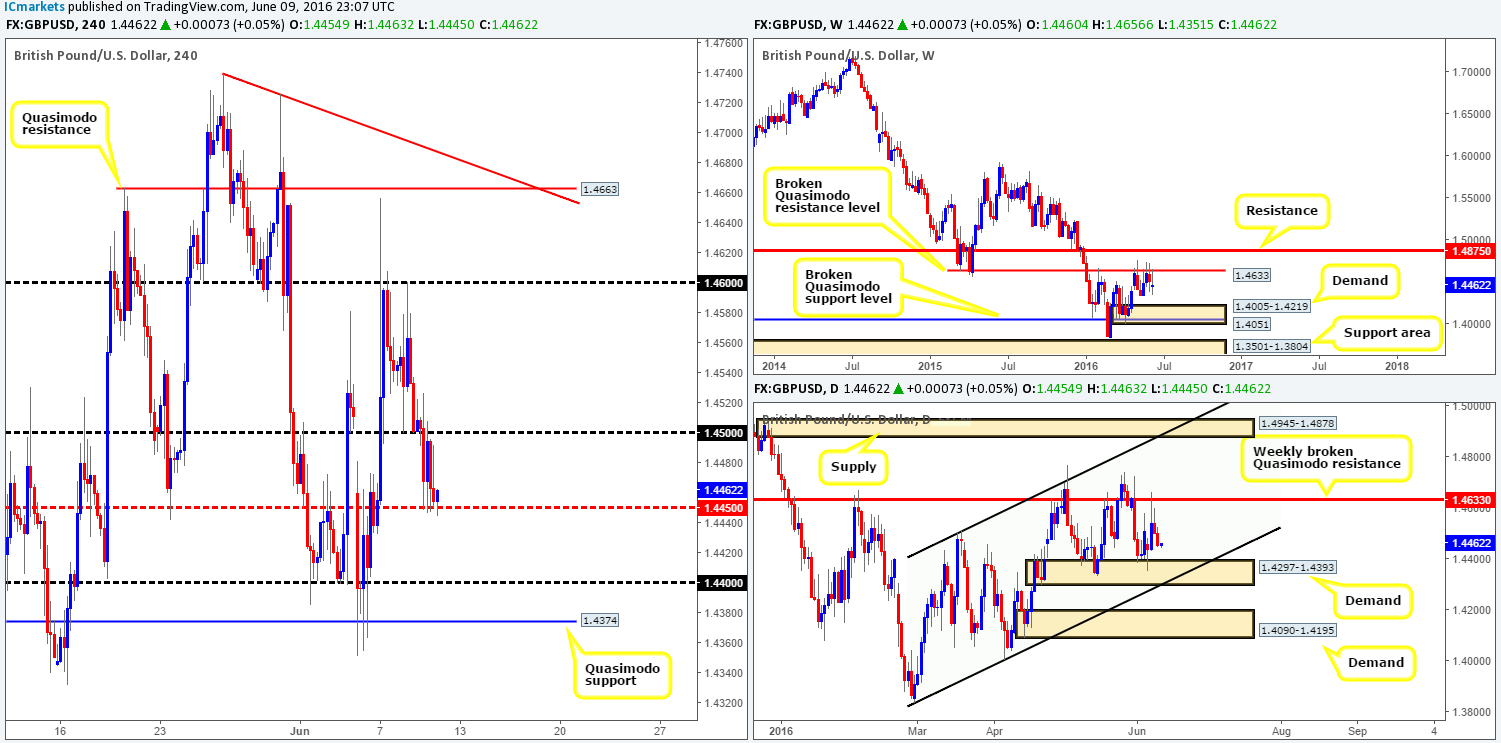
In our previous report (see the link below) our team suggested to watch for the 1.45 handle to be engulfed for a possible short trade down to 1.44. As can be seen from the H4 chart, 1.45 was taken out in the early hours of European trading yesterday and was retested as resistance going into London’s lunchtime. However, active bids from the H4 mid-way support 1.4450 has managed to hold this market higher for the time being. Despite this, we still believe cable is heading south due to the following reasons:
- The weekly chart shows the currency trading from a weekly broken Quasimodo resistance line (BQM) at 1.4633, which has capped upside in this market since February.
- Daily action has room to move lower down to daily demand at 1.4297-1.4393.
Our suggestions: In a similar fashion to the EUR/USD, we’re going to be watching for the GBP to close below 1.4450 today. This would likely set the stage for a continuation move south down to 1.44, and quite possibly the H4 Quasimodo support at 1.4374 (both located around the above said daily demand base). For us to be permitted to trade this move we’d need to see two things happen. Firstly, a retest of 1.4450 as resistance, and secondly a lower timeframe sell signal following the retest (see the top of this report for confirmation techniques).
Levels to watch/live orders:
- Buys: Flat (Stop loss: N/A).
- Sells: Watch for price to consume 1.4450 and look to trade any retest seen thereafter (lower timeframe confirmation required).
AUD/USD:
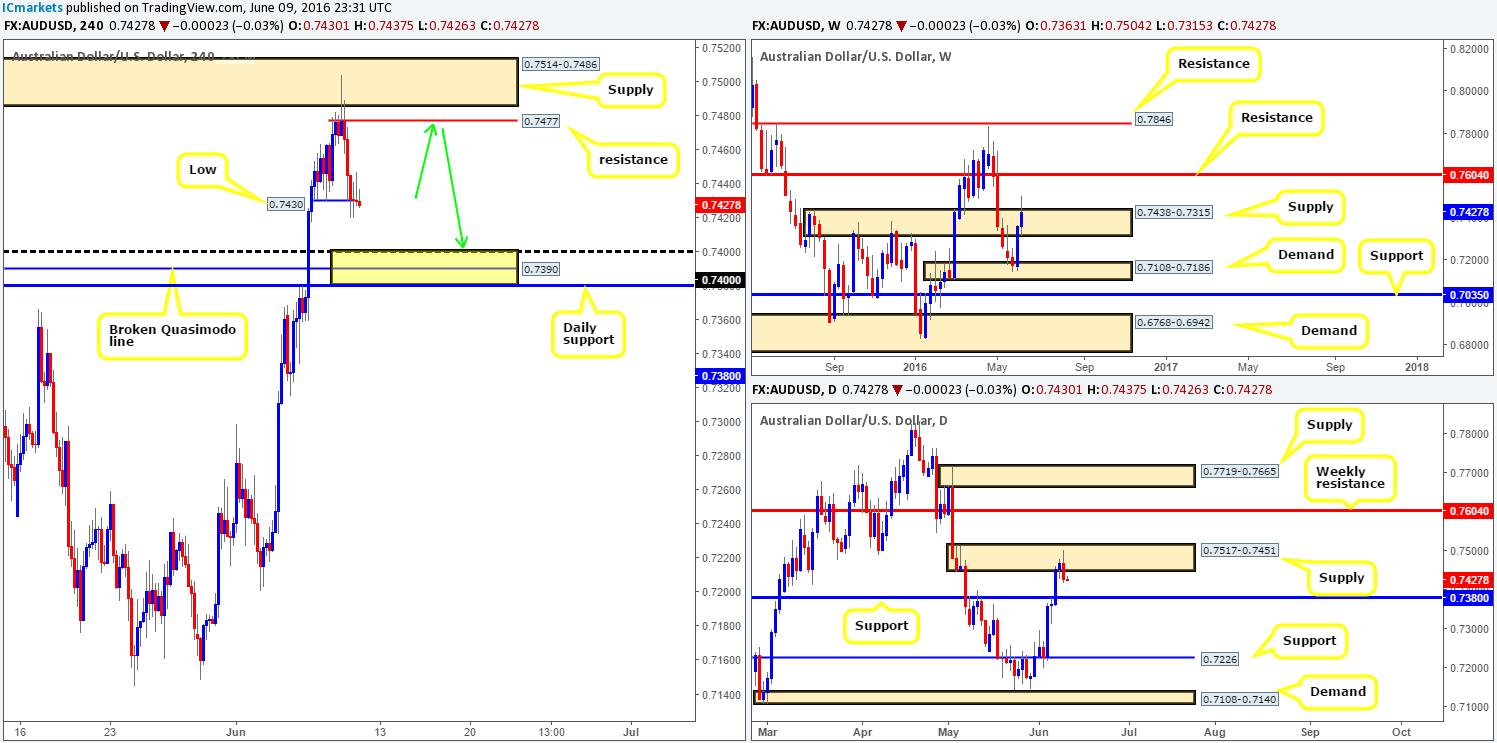
In recent sessions, we can see that the Aussie dollar sold-off from H4 supply at 0.7514-0.7486 and broke through Wednesday’s low 0.7430. To our way of seeing things, this may have unlocked the path south down to 0.7380/0.7400 (daily support at 0.7380/broken Quasimodo line 0.7390/psychological support 0.74 [yellow box]).
With H4 price looking as though it wants to push lower, let’s take a peek at what the higher timeframes are up to. Looking over to the daily chart, yesterday’s selling managed to form a daily bearish engulfing candle from within daily supply at 0.7517-0.7451. Meanwhile, up on the weekly chart, the commodity currency is now seen trading back within weekly supply at 0.7438-0.7315.
Our suggestions: Given the above points, this pair is likely to continue lower in our opinion. With that being said, we’re looking at 0.7477 (a small H4 resistance – see green arrows) for a possible short entry with our stop above the neighboring H4 supply at 0.7517. The rationale behind this approach comes from assuming that the break through the H4 low has confirmed H4 direction, so if price were to retrace from here, a sell from 0.7477 is very high probability. All of this coupled with the higher timeframes indicating lower prices could be on the horizon certainly makes this a pair worth watching today!
Levels to watch/live orders:
- Buys: Flat (Stop loss: N/A).
- Sells: 0.7477 [Depending on the time of day a market entry is possible from here] (Stop loss: 0.7517).
USD/JPY:
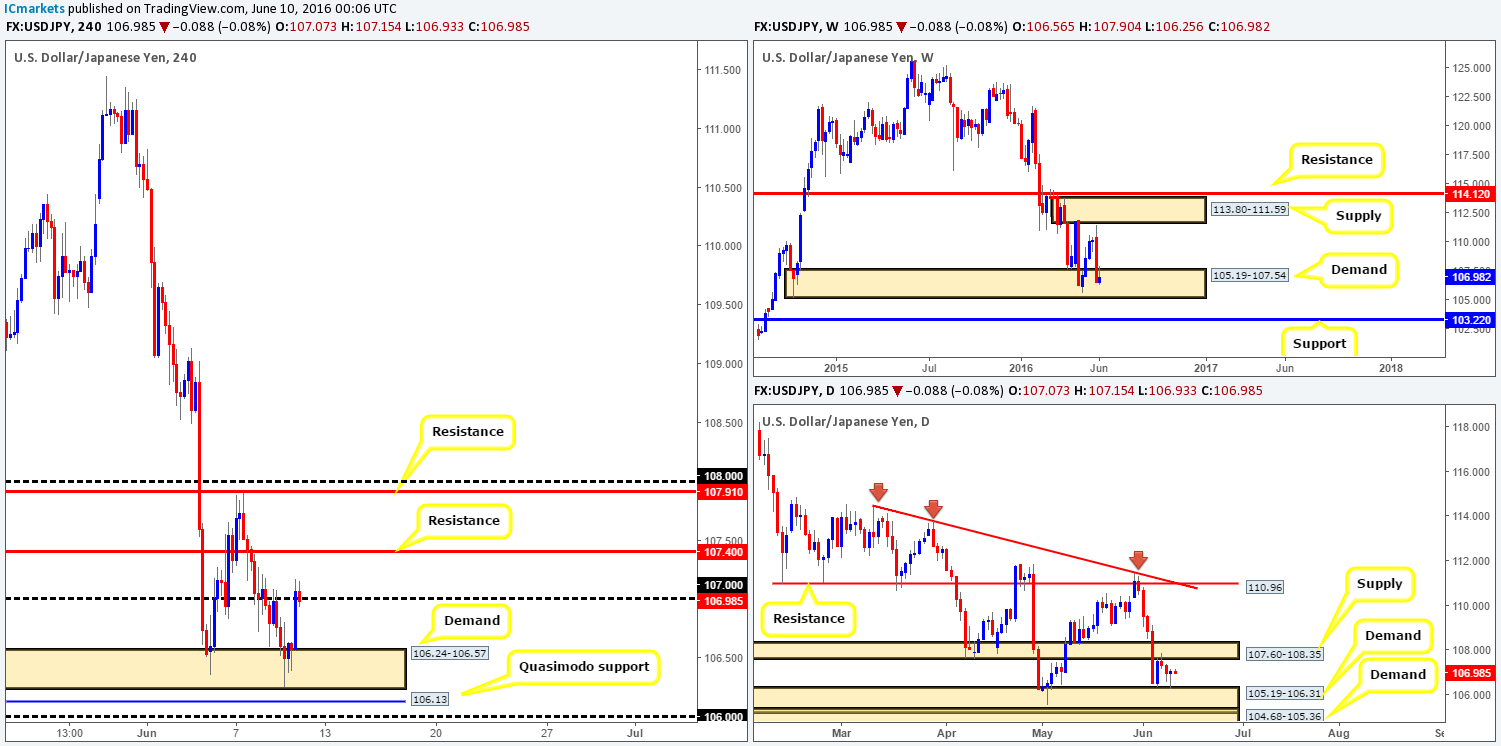
Amid the final few hours of trading yesterday, we saw the USD/JPY take on a more bullish stance from H4 demand at 106.24-106.57, which ended with the unit closing above the 107 handle by the day’s end. This move, as far as we see things, was supported by both a rally in U.S. stocks from H4 support at 17920 and a rally from H4 support at 16490 in the Nikkei index. In addition to this, we can also see daily price formed a pin bar off the top-side of a daily demand base at 105.19-106.31, and let’s not forget that weekly action remains trading within weekly demand at 105.19-107.54.
Our suggestions: Despite this pair residing within weekly demand at 105.19-107.54, and the currency trading above 107 at the moment, entering long from the H4 chart is difficult. Not only is there nearby H4 resistance at 107.40, but twenty pips above this is the underside of a daily supply area at 107.60-108.35 (the next upside target on the daily timeframe). Therefore, in a similar fashion to yesterday, our team will continue to sit on the sidelines and await more conducive price action to present itself.
Levels to watch/live orders:
- Buys: Flat (Stop loss: N/A).
- Sells: Flat (Stop loss: N/A).
USD/CAD:
Following four consecutive losing days, the Loonie seems to have recovered just ahead of the H4 mid-way support 1.2650. This – aided by a sell-off in oil, saw price take out the 1.27 number and recently connect with the H4 mid-way resistance 1.2750.
In that daily price is trading from a daily demand base at 1.2653-1.2753 right now, there is a chance that the USD may continue to strengthen against the CAD. However, with the weekly chart currently supporting further selling from its recent break of weekly support at 1.2833, we may see this pair trade down to weekly support at 1.2538 (blends nicely with trendline support extended from the high 1.1278).
Our suggestions: As you can see from the above notes, this pair is in a tricky spot at the moment. If we buy, we face the possibility of going up against weekly sellers, and if we sell, we’d be selling into daily demand! If you ask us, the best course of action today would be to take the safest position of them all: flat!
Levels to watch/live orders:
- Buys: Flat (Stop loss: N/A).
- Sells: Flat (Stop loss: N/A).
USD/CHF:
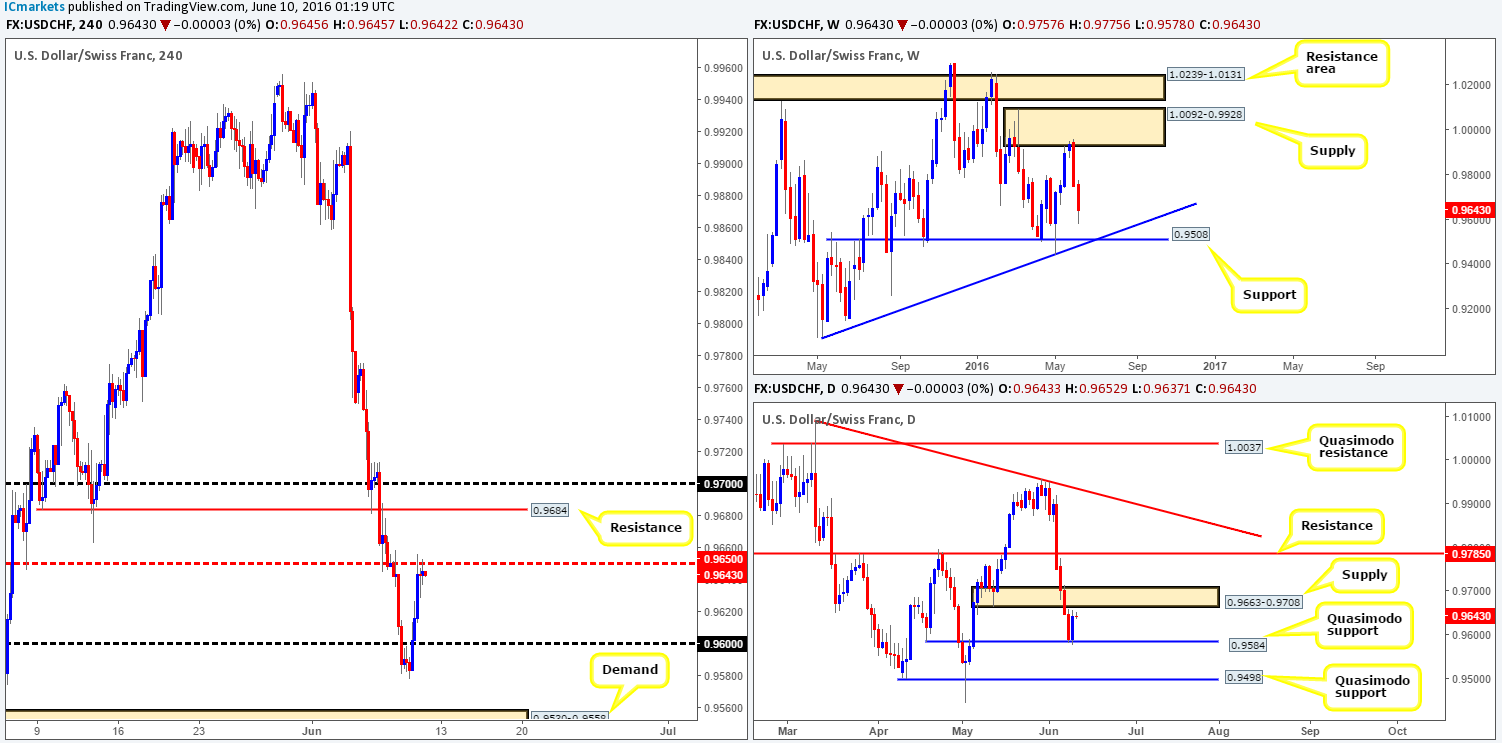
With the EUR/USD plummeting to new lows, it came as no surprise to see the USD/CHF also recover yesterday! Offers around the 0.96 handle were taken out, allowing the Swissy to gravitate north to connect with the H4 mid-way resistance 0.9650 by the day’s close. Looking over to the daily chart, it is clear to see active bids came into the market from the daily Quasimodo support line at 0.9584 yesterday, which has seen the unit close a few pips ahead of daily supply at 0.9663-0.9708. This – coupled with H4 price trading at 0.9650 should deter most from looking to buy today. If this does not, however, take a peek at the weekly chart! Notice that the currency has been steaming lower since colliding with weekly supply at 1.0092-0.9928, and shows room for further selling down to weekly support at 0.9508 (fuses with trendline support taken from the low 0.9078).
Our suggestions: Look for lower timeframe sell trades off the 0.9650 line today, targeting the 0.96 handle as your immediate take-profit area. Be prepared for price to fakeout above this level before sellers step in, nevertheless, due to the possibility that candle action may want to tag in offers around the underside of daily supply at 0.9663-0.9708. This is the main reason for requiring a lower timeframe sell setup to form before entering short (see the top of this report for ideas on how to spot selling strength).
Levels to watch/live orders:
- Buys: Flat (Stop loss: N/A).
- Sells: 0.9650 region [Tentative – confirmation required] (Stop loss: dependent on where one confirms this area).
DOW 30:
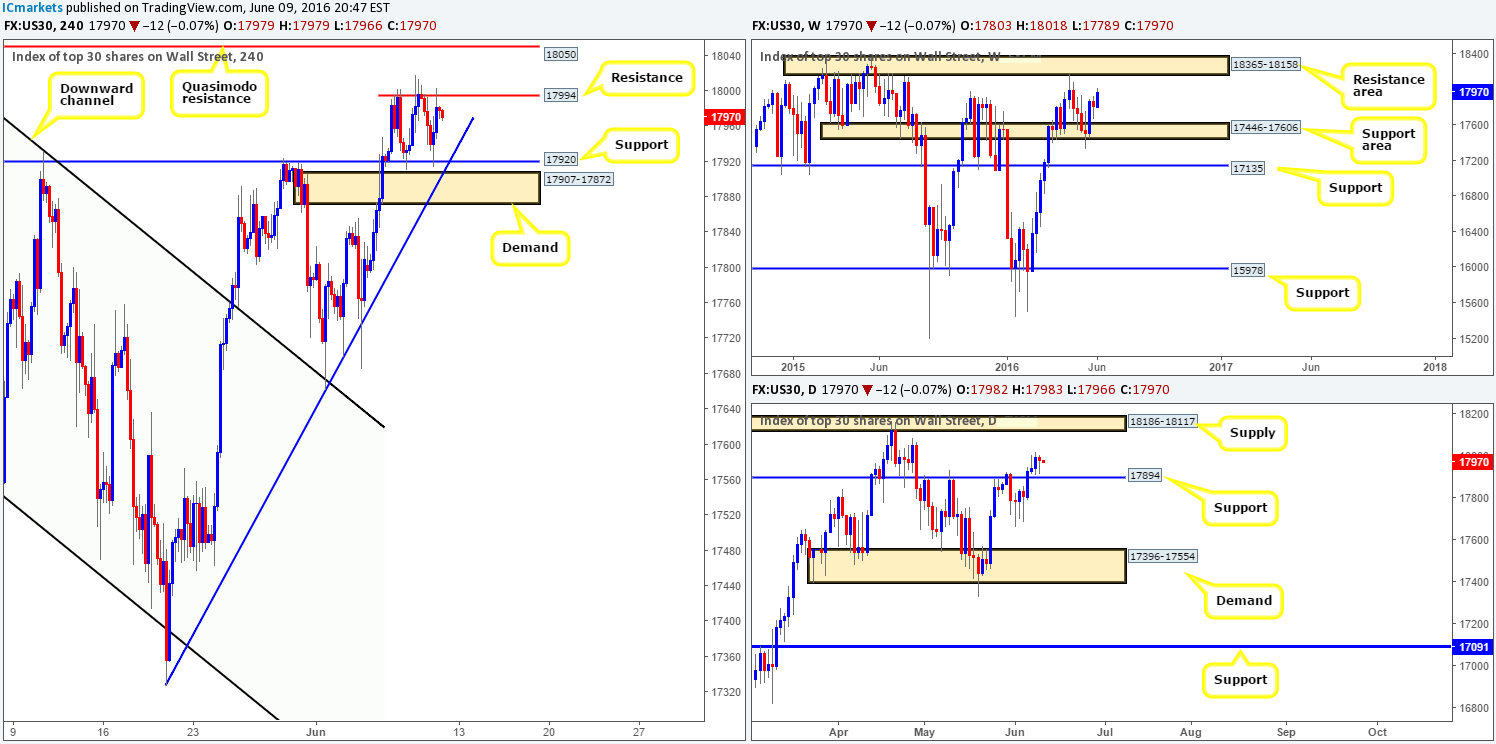
In our previous report (see link below) we spoke about the possibility that price may retreat from Tuesday’s high 18003 and retest the H4 support line at 17920. As is evident from the H4 chart, this is exactly what happened! Unfortunately we were unable to pin down a lower timeframe buy entry from 17920, so we were left behind yet again. Well done to any of our readers who managed to lock in a position from here.
In view of H4 price now seen toying with a newly-formed H4 resistance at 17994, where do we see this market headed today? Well, weekly action still shows room for this index to stretch up to the weekly resistance area at 18365-18158, whilst daily price continues to reflect a bullish stance just above daily support at 17894.
Our suggestions: Despite H4 resistance at 17994 holding the DOW lower right now, we feel price has the potential to drive to at least the H4 Quasimodo resistance at 18050, and quite possibly the underside of daily supply at 18117. As of now, however, the only entry would be to either wait and see if price retests the H4 support at 17920 for a third time, or see if the H4 candles can break above and retest the current H4 resistance as support.
Levels to watch/live orders:
- Buys: 17920 region [Tentative – confirmation required] (Stop loss: dependent on where one confirms this area). Watch for price to consume 17994 and look to trade any retest seen thereafter (lower timeframe confirmation required).
- Sells: Flat (Stop loss: N/A).
GOLD:
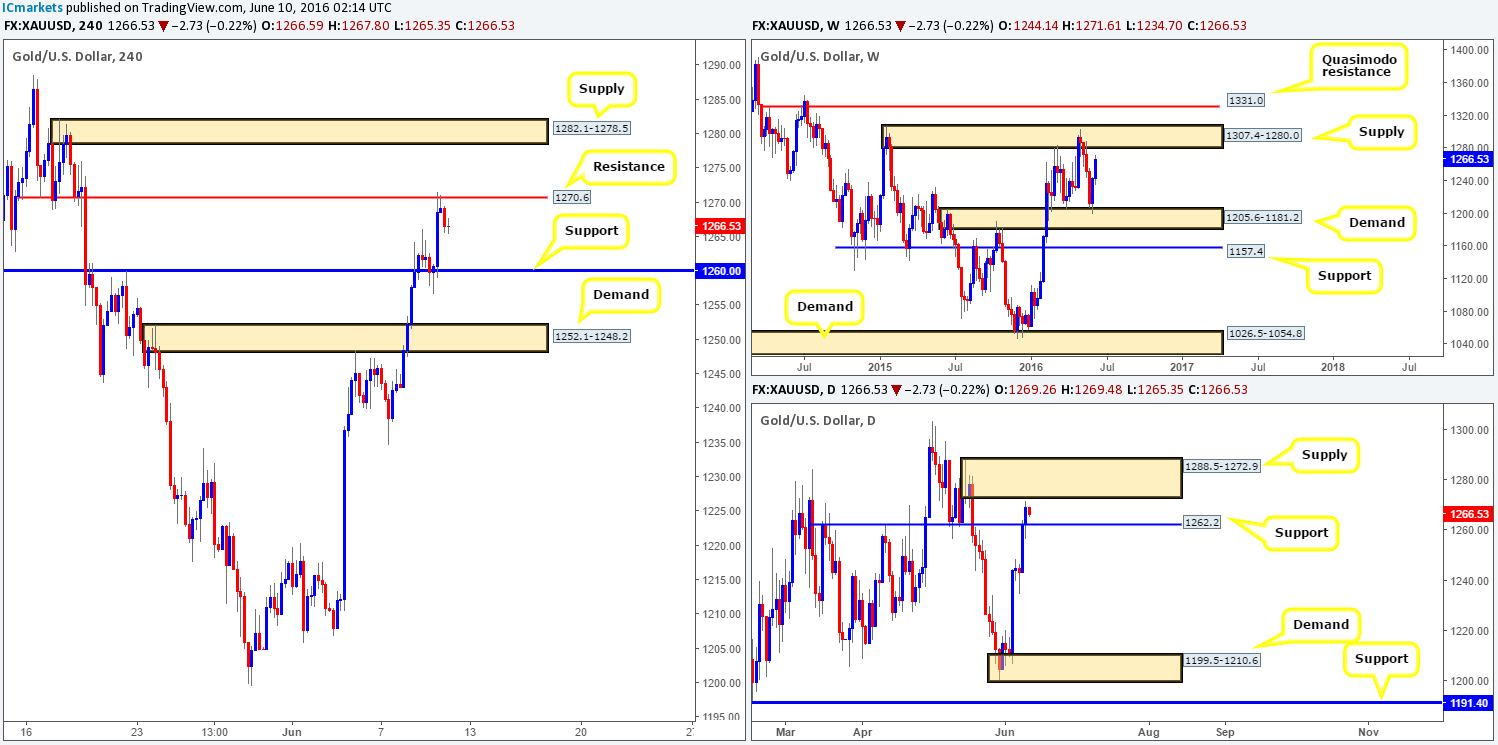
Mid-London trading saw the yellow metal resume its advance against the U.S. dollar yesterday from H4 support at 1260.0, off the back of weak equity markets. This brought gold to highs of 1271.6 and saw price shake hands with H4 resistance at 1270.6, which for now seems to be holding firm. Over on the weekly chart, we can see that there is a chance that the metal may continue to push higher to plug into offers around weekly supply coming in at 1307.4-1280.0. Looking down to the daily chart, nonetheless, price is also seen loitering within shouting distance of a daily supply base drawn from 1288.5-1272.9 (sits within the aforementioned weekly supply).
Our suggestions: Given the higher timeframe picture, we have no interest in looking to short from the H4 resistance line at 1270.6. An area we are interested in, however, is the H4 supply seen above at 1282.1-1278.5. This zone sits within both of the above said higher timeframe supplies, thus making it a beautiful barrier to sell from. A pending sell order has been placed at 1277.9 with a stop above at 1283.0.
Levels to watch/live orders:
- Buys: Flat (Stop loss: N/A).
- Sells: 1277.9 [Pending order] (Stop loss: 1283.0).

