EUR/USD:
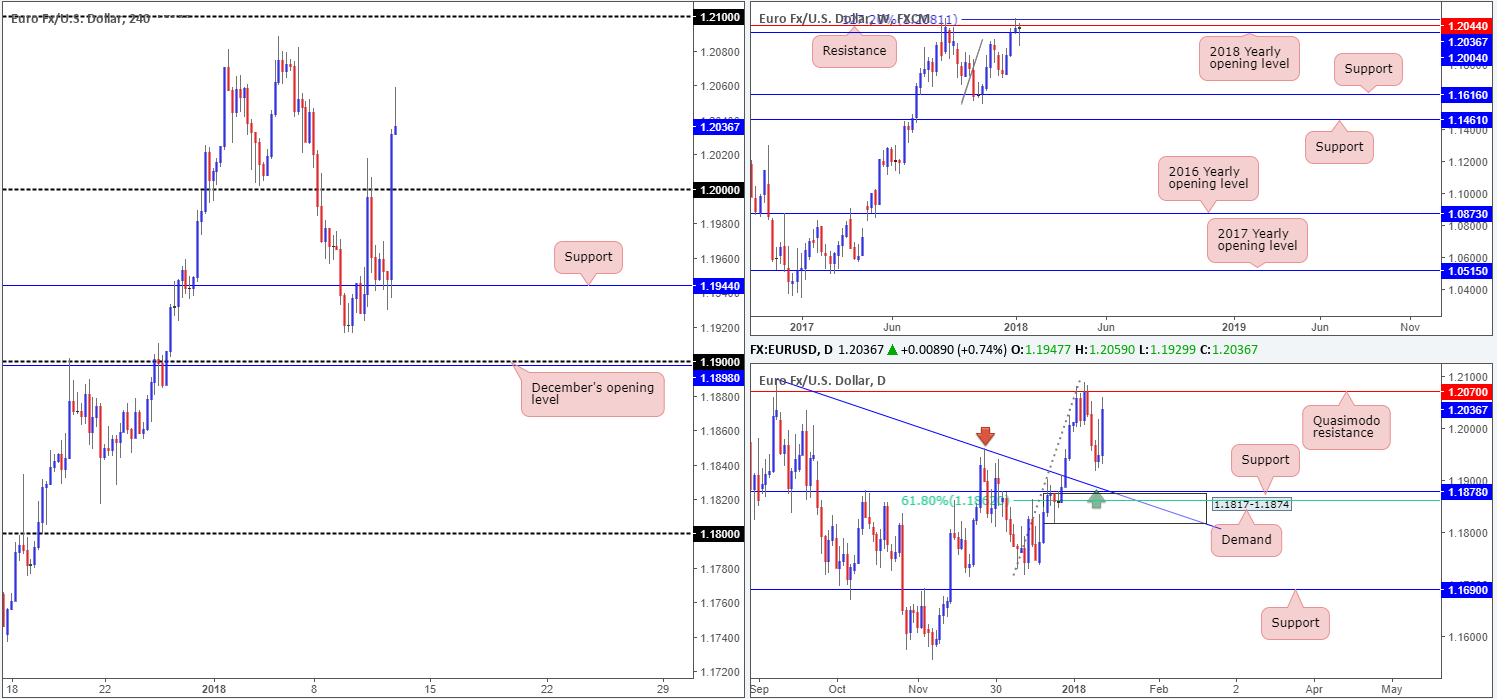
The US dollar came under fresh selling pressure on Thursday, following a disappointing round of US economic data. Producer Price Index numbers came in weaker than expected in December. In addition to this, the figure for seasonally adjusted initial unemployment claims printed at 261K vs. an expected 246K. The US dollar index fell to lows of 91.79 as a result of this, which in turn forced the single currency northbound. H4 price easily cleared the large psychological band 1.20 and clocked highs of 1.2059.
Although this move has likely excited lower-timeframe buyers, intimidating resistance is in play! Not only is there a daily Quasimodo resistance plotted nearby at 1.2070 that already proved itself last week, there is also a long-term weekly resistance seen at 1.2044 and a 127.2% weekly Fib ext. point at 1.2081.
Market direction:
In view of the unit’s close proximity to higher-timeframe resistance, buying this market is not something we’d label high probability. Equally though, a sell is also a difficult proposition. Aside from the 1.20 band now likely to offer support, another essential point worth noting is the merging 2018 yearly opening level posted on the weekly chart at 1.2004.
Until the higher-timeframe picture offers a cleaner perspective, neither a long nor short seems attractive at this time.
Data points to consider: German Buba President Weidmann speaks at 4.30pm; US CPI m/m figures and US retail sales numbers m/m at 1.30pm GMT.
Areas worthy of attention:
Supports: 1.20 handle; 1.2004.
Resistances: 1.2081; 1.2044; 1.2070.
GBP/USD:
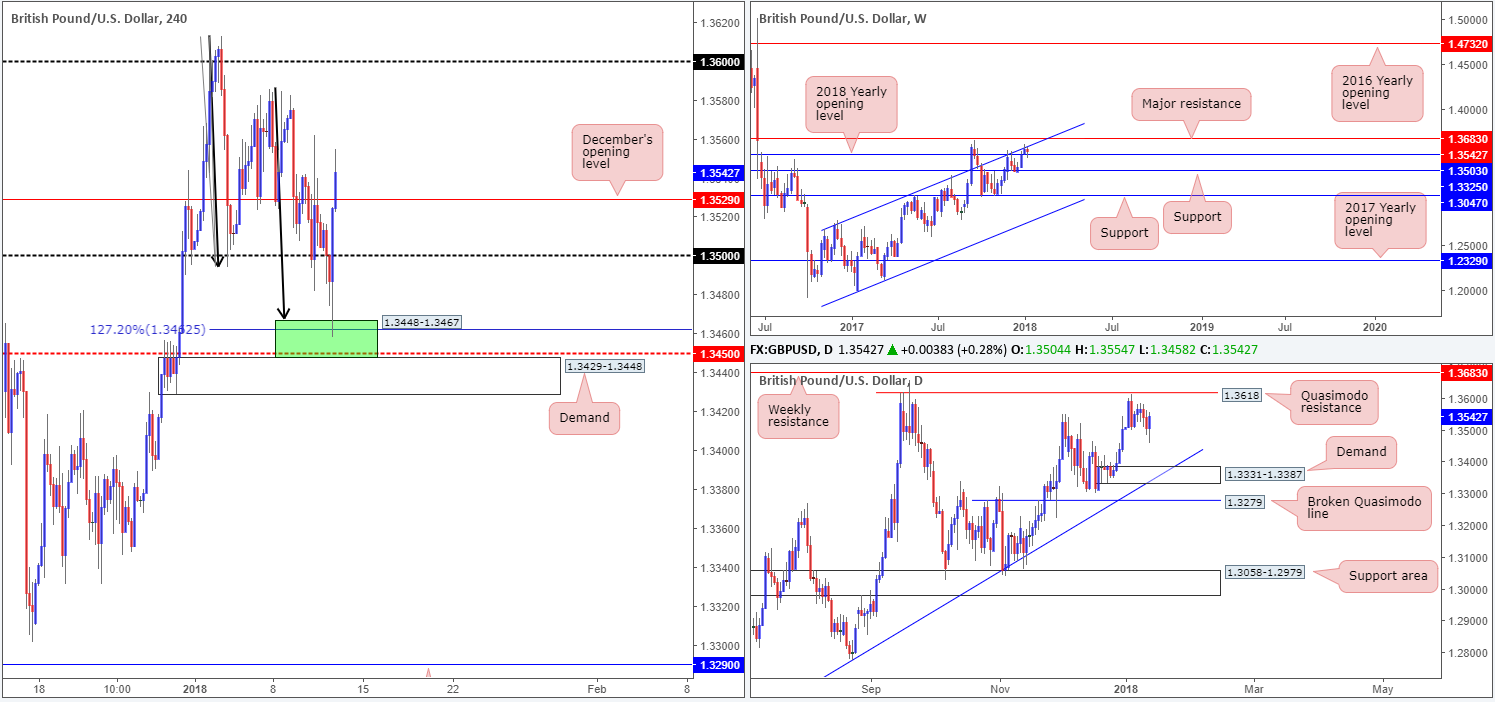
For those who read Thursday’s outlook on the GBP/USD you may recall that we highlighted a potential buy zone in the vicinity of 1.3448-1.3467 on the H4 timeframe. Comprised of a H4 AB=CD [see black arrows] 127.2% Fib ext. point at 1.3462/1.3467, a H4 mid-level support at 1.3450 and the top edge of a H4 demand at 1.3429-1.3448, the green area, as you can see, managed to rotate price to the upside. Less-than-stellar US economic data provided the pair additional fuel, enabling H4 price to chew through the 1.35 handle and penetrate December’s opening level at 1.3529. Well done to any of our readers who managed to pin down a trade from this zone!
Market direction:
Despite the upbeat tone, buyers may have to crank it into second gear if they require higher prices. We say this because on the weekly timeframe, the couple is seen trading around the underside of a weekly channel resistance extended from the high 1.2673. On a more positive note, though, daily structure shows room for the pair to trade as far north as the daily Quasimodo resistance printed at 1.3618.
A H4 close above Dec’s open level, followed up with a retest and a full or near-full-bodied bull candle would, in our technical book of setups, be enough evidence to confirm further buying. Whether the bulls have the minerals to pull the market up to the 1.36 neighborhood, however, is a different story altogether as it’s impossible to identify how resilient weekly sellers are at this time!
Data points to consider: US CPI m/m figures and US retail sales numbers m/m at 1.30pm GMT.
Areas worthy of attention:
Supports: 1.3448-1.3467; 1.35 handle; 1.3529 (potentially); 1.3503.
Resistances: Weekly channel resistance; 1.3618.
AUD/USD:
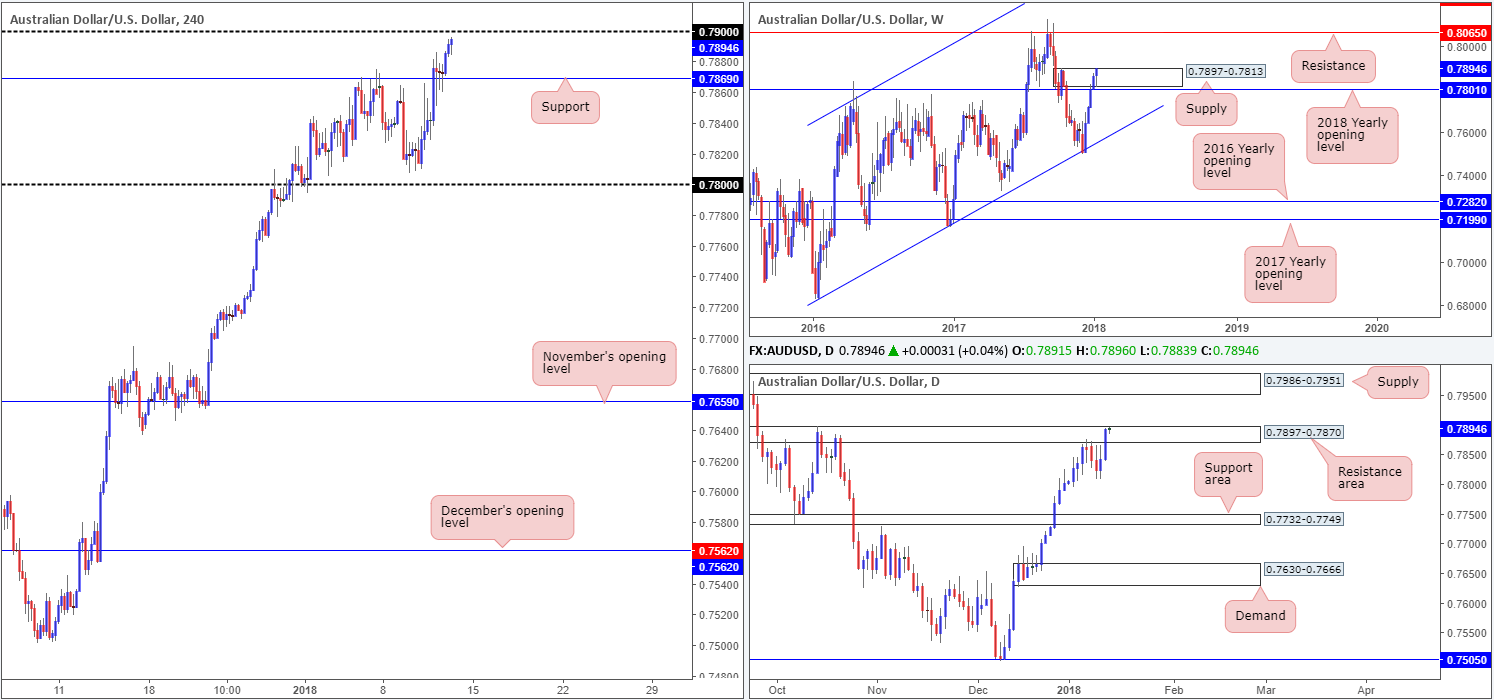
As can be seen from the H4 timeframe this morning, the commodity-linked currency found active buyers around H4 support coming in at 0.7869. On the back of a disappointing round of US economic data, the H4 candles were able to wind up closing the day just ahead of the 0.79 handle.
Over on the bigger picture, this translates to a push higher within the walls of a weekly supply seen at 0.7897-0.7813. A clean break beyond this area might indicate higher prices up to as far north as the weekly resistance line at 0.8065. Also worth observing is the daily resistance area seen positioned within the upper limits of the said weekly supply at 0.7897-0.7870. The next upside target beyond this daily zone can be seen at 0.7986-0.7951: a daily supply zone.
Market direction:
0.79 is a key level in this market. It will, in our technical opinion, play a role in deciding the market’s next move.
A rejection of this number may help rescue struggling sellers within the higher-timeframe resistances mentioned above, and force another retest of H4 support at 0.7896. A violation of 0.79, on the other hand, could see a push up to H4 resistance at 0.7941, followed closely by a H4 broken Quasimodo line at 0.7956 (not seen on the screen), and consequently take stops above the higher-timeframe areas.
Also note that the aforementioned H4 resistances converge beautifully around the underside of the said daily resistance area! Breakout buyers of 0.79 might want to take this into account as it could be problematic.
Data points to consider: US CPI m/m figures and US retail sales numbers m/m at 1.30pm GMT.
Areas worthy of attention:
Supports: 0.7896.
Resistances: 0.7897-0.7813; 0.8065; 0.7897-0.7870; 0.7986-0.7951; 0.79 handle.
USD/JPY:
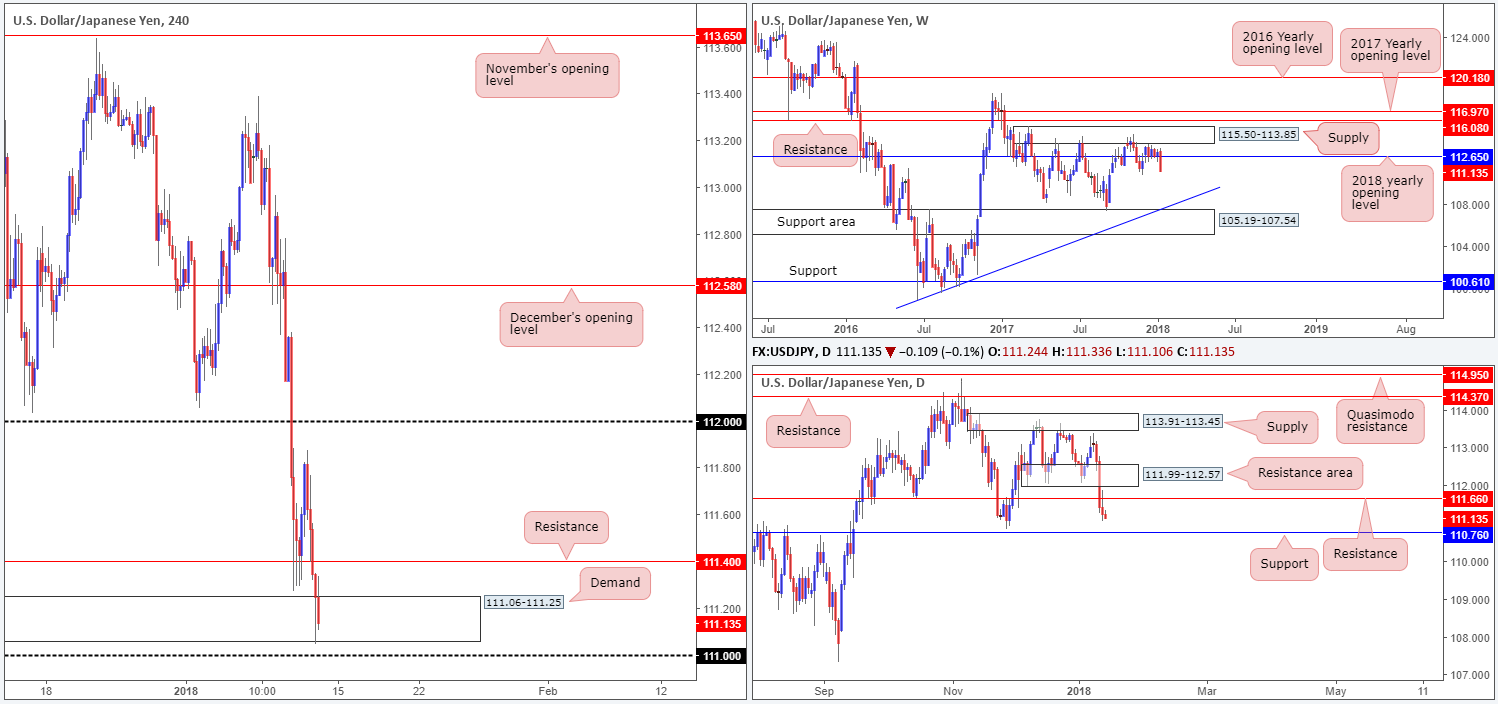
Despite an earnest attempt to push higher from H4 support at 111.40 (DEC 1 low), it was met with strong selling pressure on Thursday. 111.40 was quickly consumed, allowing H4 price to shake hands with H4 demand at 111.06-111.25. So far, H4 bulls have yet to register anything meaningful from here which could portend a drop down to the nearby 111 handle.
According to daily structure, the recent break of daily support at 111.66 (now acting resistance) has opened up the path south down to daily support pegged at 110.76. Be that as it may, knowing that there is a collection of H4 supports in play, selling this market on the basis of a violation of daily support remains a weak setup, in our humble view.
Market direction:
With limited space seen to the downside right now, as well as little agreement being seen between H4/daily structures, we feel that opting to stand on the sidelines may, once again, be the best route to take today.
Data points to consider: US CPI m/m figures and US retail sales numbers m/m at 1.30pm GMT.
Areas worthy of attention:
Supports: 111.06-111.25; 111 handle; 110.76.
Resistances: 111.40; 111.99-112.57; 111.66.
USD/CAD:
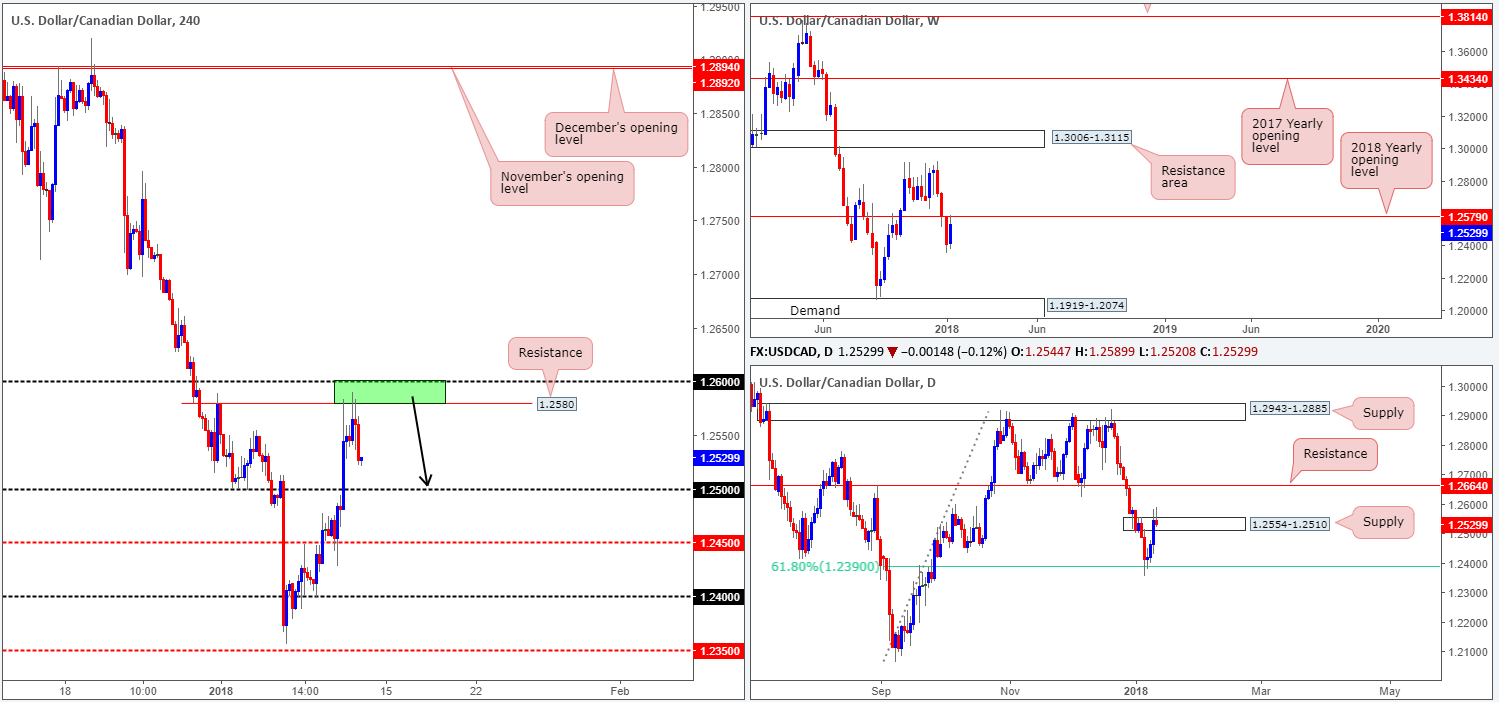
In our previous report, we underlined a significant resistance zone between the 1.26 handle seen on the H4 timeframe and a H4 resistance band placed at 1.2580 (green rectangle). The reasoning behind selecting this area was due to the resistance holding back the buyers on Wednesday, as well as additional resistance coming in from the 2018 yearly opening level seen on the weekly timeframe at 1.2579. What also drew us to the zone was the daily supply zone at 1.2554-1.2510. Despite having the top edge taken out, the area was strong enough to remain in the fight!
Market direction:
Technically speaking, we do not see a whole lot stopping the H4 candles from connecting with the 1.25 handle. Daily structure shows price could stretch as far south as 1.2390: a 61.8% daily Fib support, and weekly price appears clear down to weekly demand at 1.1919-1.2074.
As a result, should H4 price shake hands with 1.25 in upcoming sessions, a close beneath this number is a real possibility, with the prospect of 1.24ish in the near future. Well done to any of our readers who managed to take advantage of 1.26/1.2580.
Data points to consider: US CPI m/m figures and US retail sales numbers m/m at 1.30pm GMT.
Areas worthy of attention:
Supports: 1.25 handle; 1.24 handle; 1.2390.
Resistances: 1.26 handle; 1.2580; 1.2579; 1.2554-1.2510.
USD/CHF:
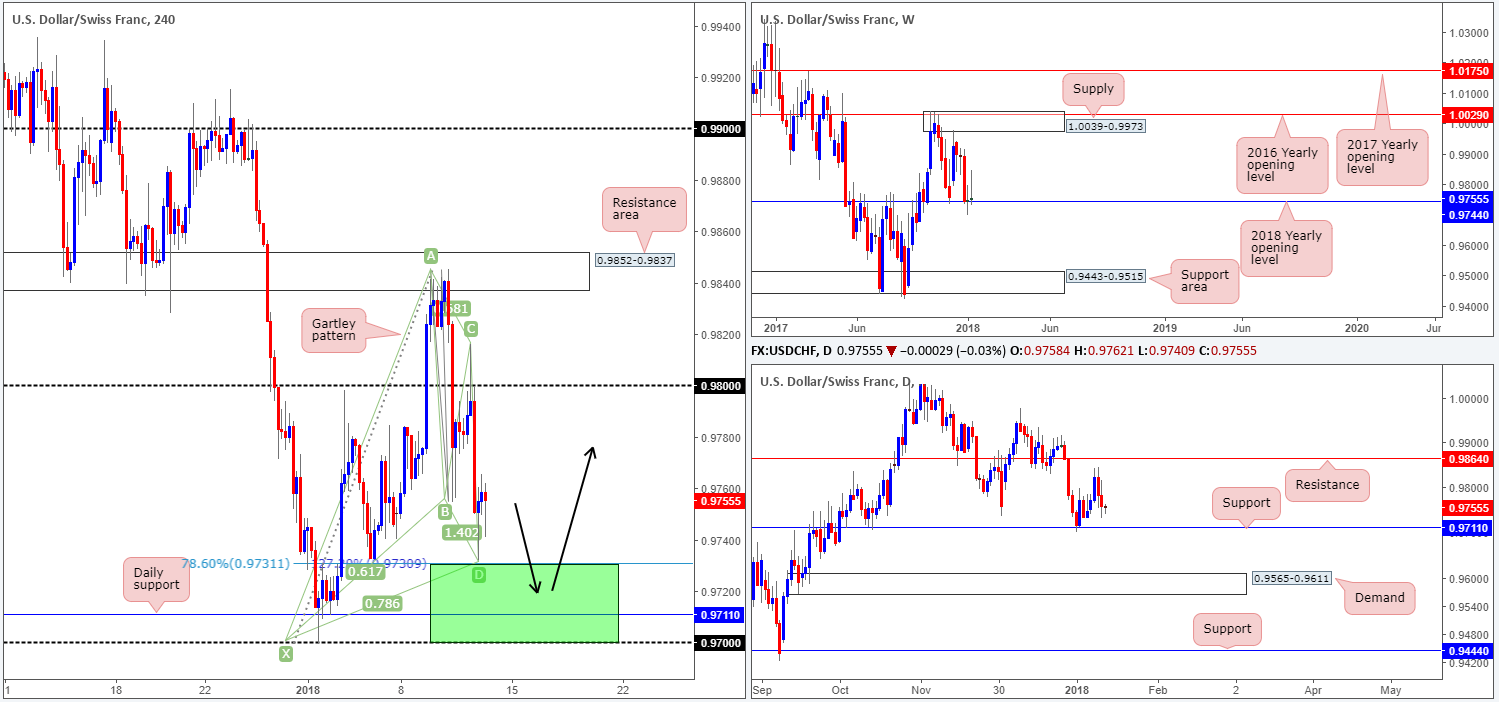
Less-than-stellar US economic data helped fuel a retest off of the 0.98 handle on Thursday, bringing the unit down to lows of 0.9732. What this also did, however, was create a nice-looking H4 harmonic gartley pattern that completes around the 0.9730ish range (78.6% H4 Fib support).
Bolstering this harmonic pattern is the 2018 yearly opening level printed on the weekly chart at 0.9744, and also a daily support seen nearby at 0.9711.
Market direction:
Ideally, it would be fantastic to see price dive into the green (harmonic buy zone) area between the 0.97 handle and 0.9730 today, as there’s clear confluence suggesting a bounce higher from here is on the cards, targeting at least the 0.98 region. A test of the aforementioned daily support would be mouthwatering. Stops, technically speaking, could be positioned beneath a H4 demand formed back on Oct 2 at 0.9709-0.9695.
Data points to consider: US CPI m/m figures and US retail sales numbers m/m at 1.30pm GMT.
Areas worthy of attention:
Supports: 0.97/0.9730; 0.9711; 0.9744.
Resistances: 0.98 handle.
DOW 30:
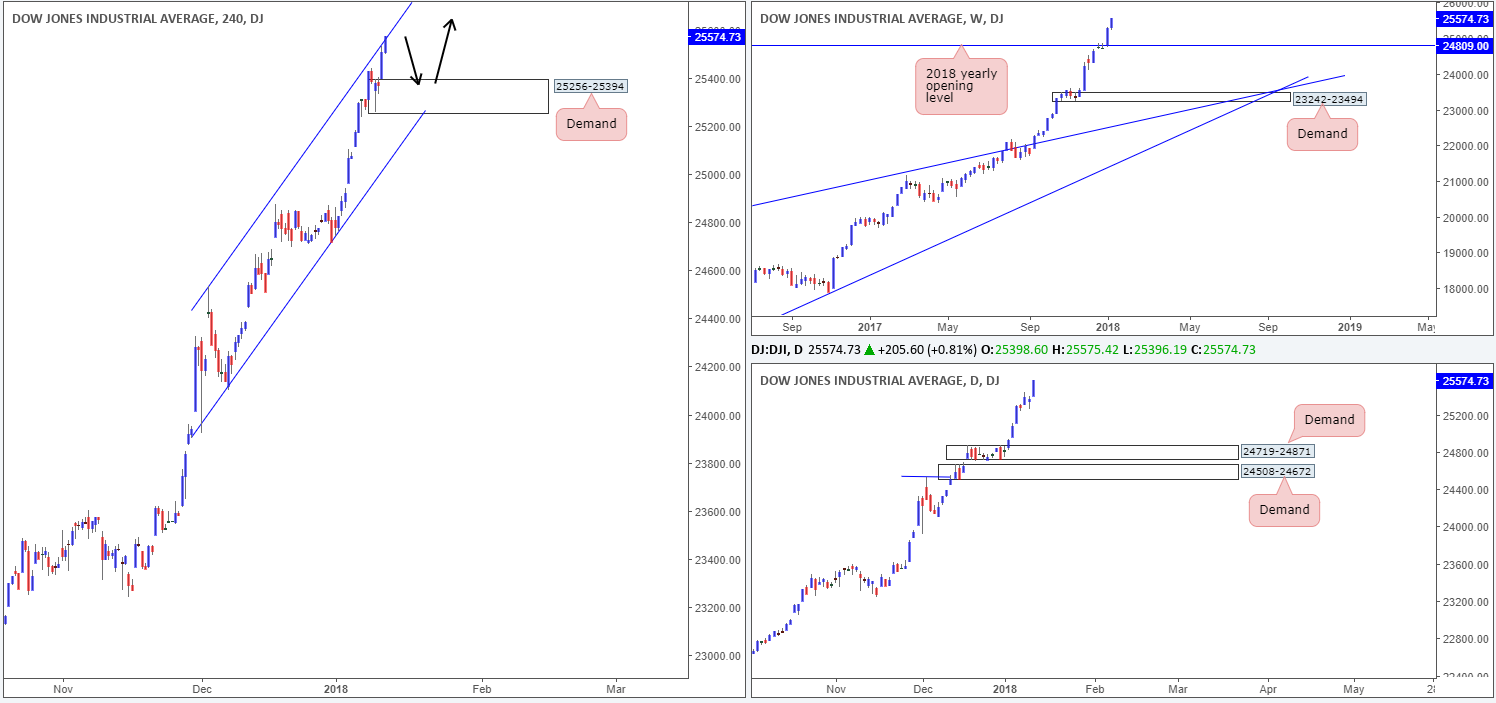
US equities extended higher on Thursday, challenging the H4 channel resistance extended from the high 24535.In order for the index to continue refreshing record highs, H4 price would need to engulf this line.
Before this happens, though, investors need to be prepared for the possibility of a pullback to a nearby H4 demand base coming in at 25256-25394.
Market direction:
Although the trend remains strong, this is still not a buyers’ market, in our view. Once/if H4 price engulfs the H4 channel resistance, however, then we do not see much stopping prices from moving higher, at least from a technical standpoint.
Buying on a dip seen down to the current H4 demand is also a possibility, as per black arrows.
Data points to consider: US CPI m/m figures and US retail sales numbers m/m at 1.30pm GMT.
Areas worthy of attention:
Supports: 25256-25394.
Resistances: H4 channel resistance.
GOLD:
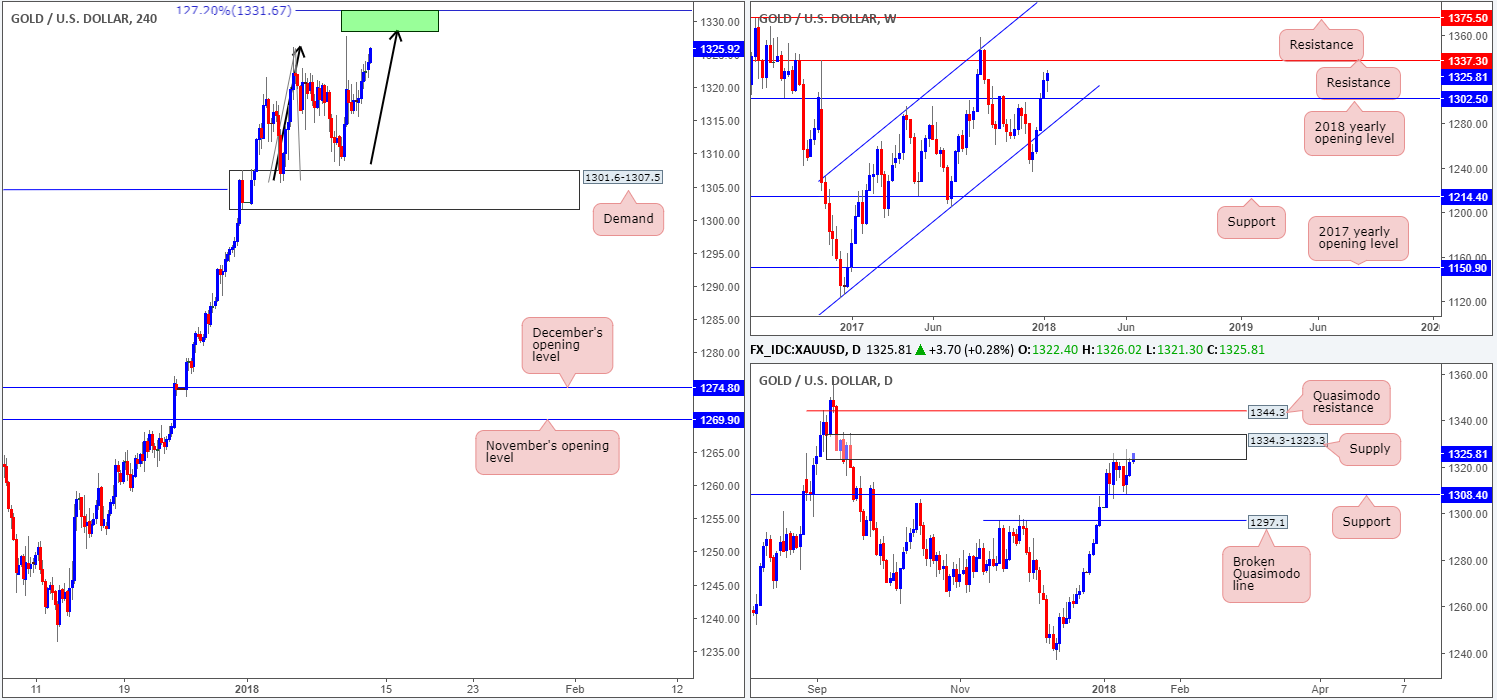
Across the board, we saw the US dollar plummet against the majority of its trading peers on Thursday. This provided an already upbeat gold market a boost, pulling the yellow metal to highs of 1323.9 and positioning the H4 candles within striking distance of a H4 AB=CD completion area (127.2%: 1331.6/1325.4).
Now, going by the structure presented on the weekly timeframe, there’s not a whole lot stopping the piece extending recent gains up to as far north as the weekly resistance level coming in at 1337.3. Contrary to this, however, daily action is faced with a supply zone plotted at 1334.3-1323.3.
Market direction:
The question then, as we see it, is, are you willing to sell the H4 AB=CD formation knowing that it is backed by a daily supply zone, but against potential weekly flow?
Under such situations as these, we generally see two options. The first is to simply pass on the setup. The second is instead of placing pending sell order at the H4 AB=CD sell zone, wait for H4 price to connect and prove seller intent. What we mean by seller intent is simply a full or near-full-bodied H4 bearish candle. Of course, this will not guarantee a winning trade, but what it will do is give one an indication as to who’s active.
Areas worthy of attention:
Supports: …
Resistances: 1337.3; 1334.3-1323.3: 1331.6/1325.4.
This site has been designed for informational and educational purposes only and does not constitute an offer to sell nor a solicitation of an offer to buy any products which may be referenced upon the site. The services and information provided through this site are for personal, non-commercial, educational use and display. IC Markets does not provide personal trading advice through this site and does not represent that the products or services discussed are suitable for any trader. Traders are advised not to rely on any information contained in the site in the process of making a fully informed decision.
This site may include market analysis. All ideas, opinions, and/or forecasts, expressed or implied herein, information, charts or examples contained in the lessons, are for informational and educational purposes only and should not be construed as a recommendation to invest, trade, and/or speculate in the markets. Any trades, and/or speculations made in light of the ideas, opinions, and/or forecasts, expressed or implied herein, are committed at your own risk, financial or otherwise.
The use of the site is agreement that the site is for informational and educational purposes only and does not constitute advice in any form in the furtherance of any trade or trading decisions.
The accuracy, completeness and timeliness of the information contained on this site cannot be guaranteed. IC Markets does not warranty, guarantee or make any representations, or assume any liability with regard to financial results based on the use of the information in the site.
News, views, opinions, recommendations and other information obtained from sources outside of www.icmarkets.com.au, used in this site are believed to be reliable, but we cannot guarantee their accuracy or completeness. All such information is subject to change at any time without notice. IC Markets assumes no responsibility for the content of any linked site. The fact that such links may exist does not indicate approval or endorsement of any material contained on any linked site.
IC Markets is not liable for any harm caused by the transmission, through accessing the services or information on this site, of a computer virus, or other computer code or programming device that might be used to access, delete, damage, disable, disrupt or otherwise impede in any manner, the operation of the site or of any user’s software, hardware, data or property.
