A note on lower timeframe confirming price action…
Waiting for lower timeframe confirmation is our main tool to confirm strength within higher timeframe zones, and has really been the key to our trading success. It takes a little time to understand the subtle nuances, however, as each trade is never the same, but once you master the rhythm so to speak, you will be saved from countless unnecessary losing trades. The following is a list of what we look for:
- A break/retest of supply or demand dependent on which way you’re trading.
- A trendline break/retest.
- Buying/selling tails/wicks – essentially we look for a cluster of very obvious spikes off of lower timeframe support and resistance levels within the higher timeframe zone.
- Candlestick patterns. We tend to only stick with pin bars and engulfing bars as these have proven to be the most effective.
We search for lower timeframe confirmation between the M15 and H1 timeframes, since most of our higher-timeframe areas begin with the H4. Stops are usually placed 5-10 pips beyond confirming structures.
EUR/USD:
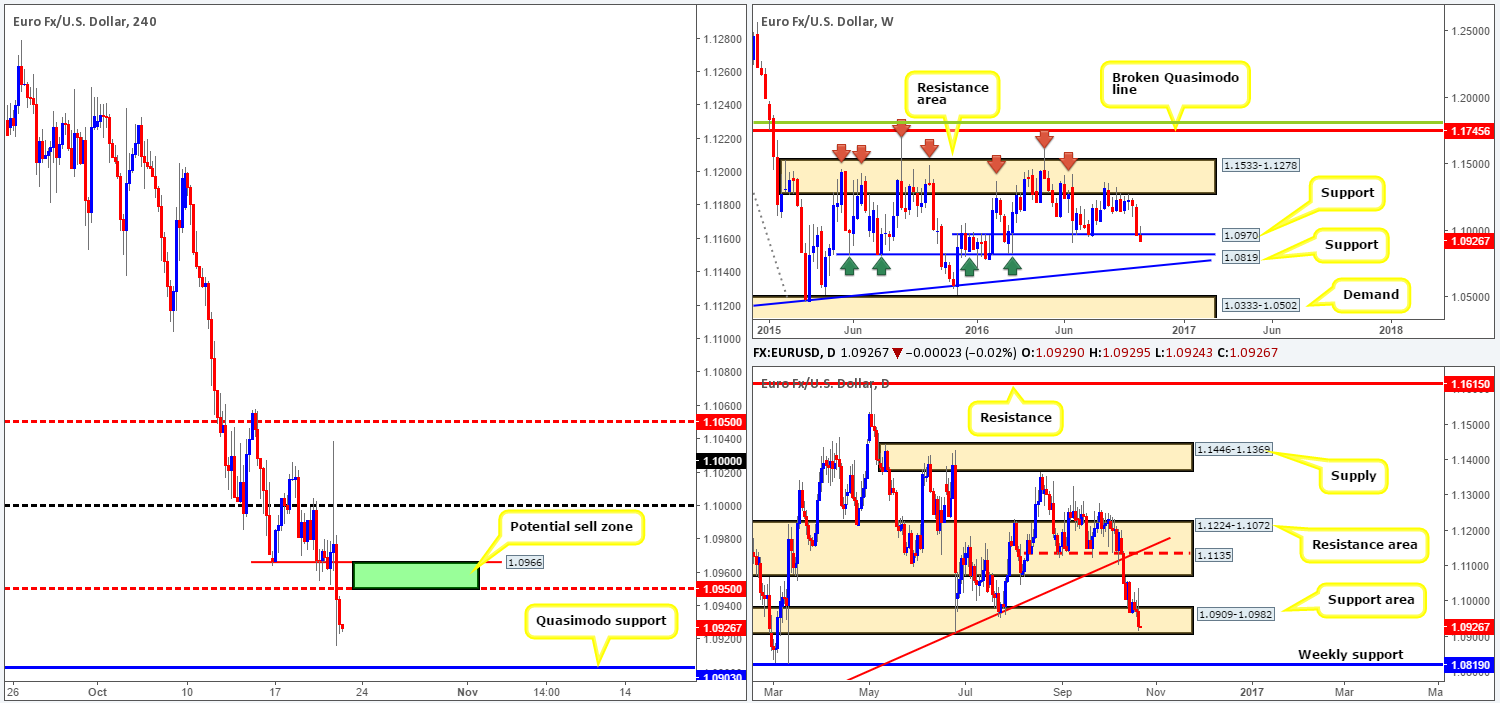
The EUR/USD experienced a rather aggressive swing to the upside yesterday, reaching highs of 1.1039, after President Draghi highlighted that the central bank’s governing policy had not discussed extending its quantitative easing (QE) program. The move was a short-lived one, however, as Draghi then went on to comment that there had been no discussion regarding tapering QE, consequently sending the shared currency into a free-fall!
The H4 mid-way support 1.0950 was taken out, which has likely opened up the doors for price to challenge the H4 Quasimodo support at 1.0903. Meanwhile, over on the bigger picture, weekly price has violated support at 1.0970. Should the market close the week beyond this level, this could stimulate further downside towards support drawn from 1.0819 next week. Looking down to the daily chart, nevertheless, the candles are still seen enclosed within a support area at 1.0909-1.0982. Little bullish intention has been registered from this zone over the past week and as price is now seen trading around the lower edge of this boundary, this could suggest a break lower may be on the cards, possibly leading to a decline down to weekly support mentioned above at 1.0819.
Our suggestions: Given the weekly push beyond support, and room seen for H4 price to decline south to a H4 Quasimodo support, we feel a sell from the 1.0966/1.0950 region could be something to consider (green zone). Not only does this area represent a H4 mid-way resistance barrier, it also serves as the underside of the recently broken weekly support at 1.0970. To avoid being stopped out on a fakeout above this zone, nonetheless, we’d advise waiting for a H4 bear candle to form before looking to pull the trigger.
Levels to watch/live orders:
- Buys: Flat (Stop loss: N/A).
- Sells: 1.0966/1.0950 region ([H4 bearish close required prior to pulling the trigger] Stop loss: ideally beyond the trigger candle).
GBP/USD:
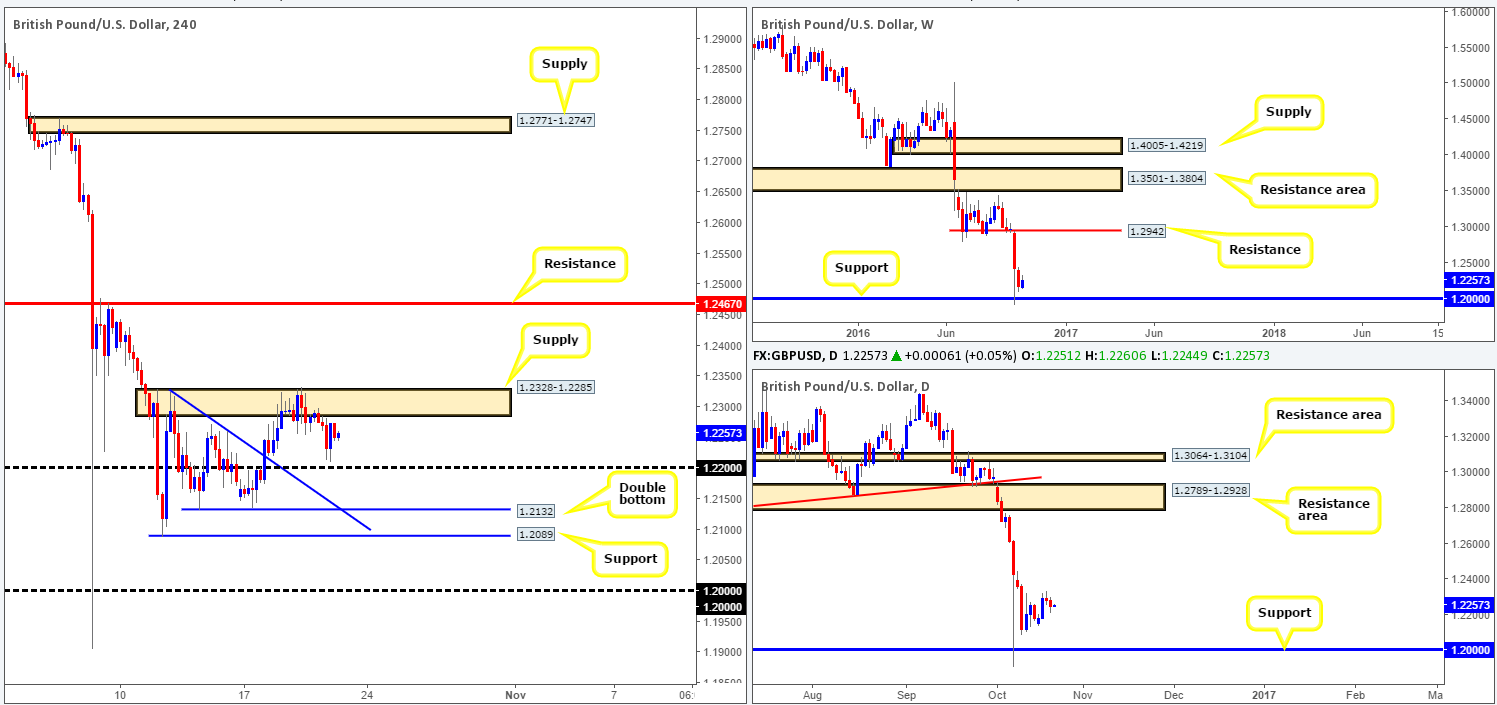
Recent action shows that the GBP extended its bounce from H4 supply at 1.2328-1.2285 down to lows of 1.2209 yesterday, following comments made by ECB President Mario Draghi regarding the quantitative easing program. Although the session ended in the red, an end-of-day correction was seen, consequently pushing cable to highs of 1.2273 by the close.
While the majority of market players believe the pound could head further south in the future, let’s keep in mind that on the monthly chart price has touched base with a major demand, with 1.20 representing the top edge (http://fxtop.com/en/historical-exchange-rates-graph-zoom.php?C1=GBP&C2=USD&A=1&DD1=07&MM1=10&YYYY1=1960&DD2=14&MM2=10&YYYY2=2016&LARGE=1&LANG=en&VAR=0&MM1M=0&MM3M=0&MM1Y=0). Therefore, a break above the current H4 supply could, at least from a technical standpoint, suggest that the pair may advance north to at least the H4 resistance coming in at 1.2467.
Our suggestions: Taking into account the above points here’s what we have jotted down so far:
- A long could be considered on the close above the current H4 supply area. For us personally, we’d also require a retest followed up by a reasonably sized H4 bullish close, before we’d look to pull the trigger.
- Supposing the market breaches the 1.22 handle, the runway south looks relatively free down to a H4 double-bottom support at 1.2132, followed closely by support at 1.2089. Again though, our team would require a retest to the underside of 1.22 along with a reasonably sized H4 bearish close. This is a trade we would deem valid, given that there is room seen on both the weekly and daily charts for price to retest the 1.20 band.
Levels to watch/live orders:
- Buys: Watch for a close above the H4 supply at 1.2328-1.2285 and then look to trade any retest seen thereafter (H4 bullish close required prior to pulling the trigger).
- Sells: Watch for a close below the 1.22 region and then look to trade any retest seen thereafter (H4 bearish close required prior to pulling the trigger).
AUD/USD:
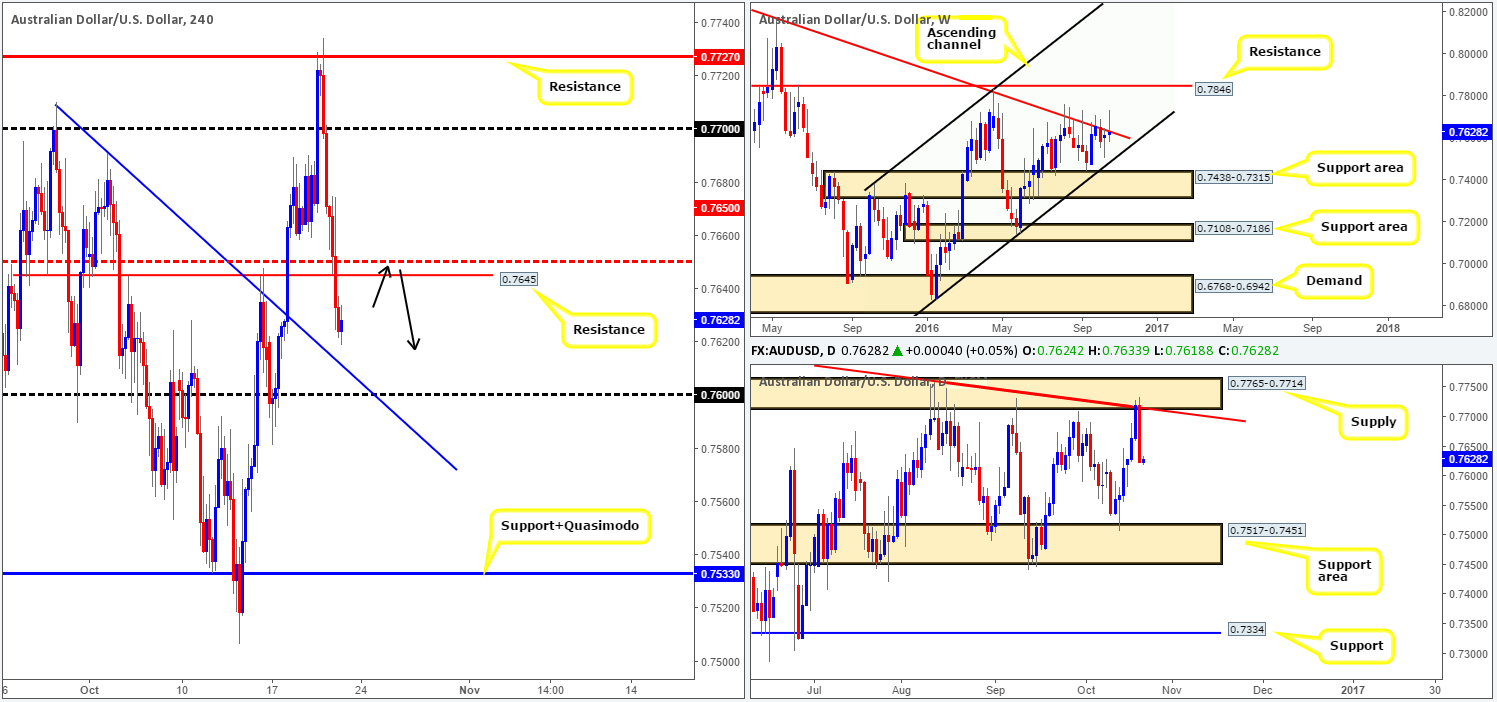
Australian employment data reported a worse than expected month yesterday, resulting in the commodity currency plunging around 100 pips on the day! From the weekly chart, this has, as you can see, brought the unit back below the trendline resistance extended from the high 0.8295. Looking down to the daily chart, the market responded beautifully to the supply zone at 0.7765-0.7714 and its corresponding trendline resistance taken from the high 0.7835. On both the weekly and daily charts, we see little standing in the way of further selling, with the weekly ascending channel support (0.6827) line likely being the next downside target on the hit list.
Yesterday’s bout of selling took out quite a few H4 tech supports during its onslaught. The final line was support at 0.7645, which initially did show some resilience. As we write, the H4 candles appear to be bottoming out ahead of a trendline support drawn from the high 0.7710. Should the bulls continue to bid price higher from here, we may see price reconnect with the recently broken support 0.7645 (now acting resistance).
Our suggestions: Between the H4 mid-way resistance 0.7650 and H4 resistance 0.7645, we believe, given the higher-timeframe picture, this small area has the potential to suppress buying. Therefore, on the back of a lower timeframe sell signal (see the top of this report for ideas on lower timeframe entry techniques), we would look to jump in short here, targeting the 0.76 handle and aforementioned H4 trendline support.
Levels to watch/live orders:
- Buys: Flat (Stop loss: N/A).
- Sells: 0.7650/0.7645 region ([lower timeframe confirmation required] Stop loss: dependent on where one confirms this area).
USD/JPY:
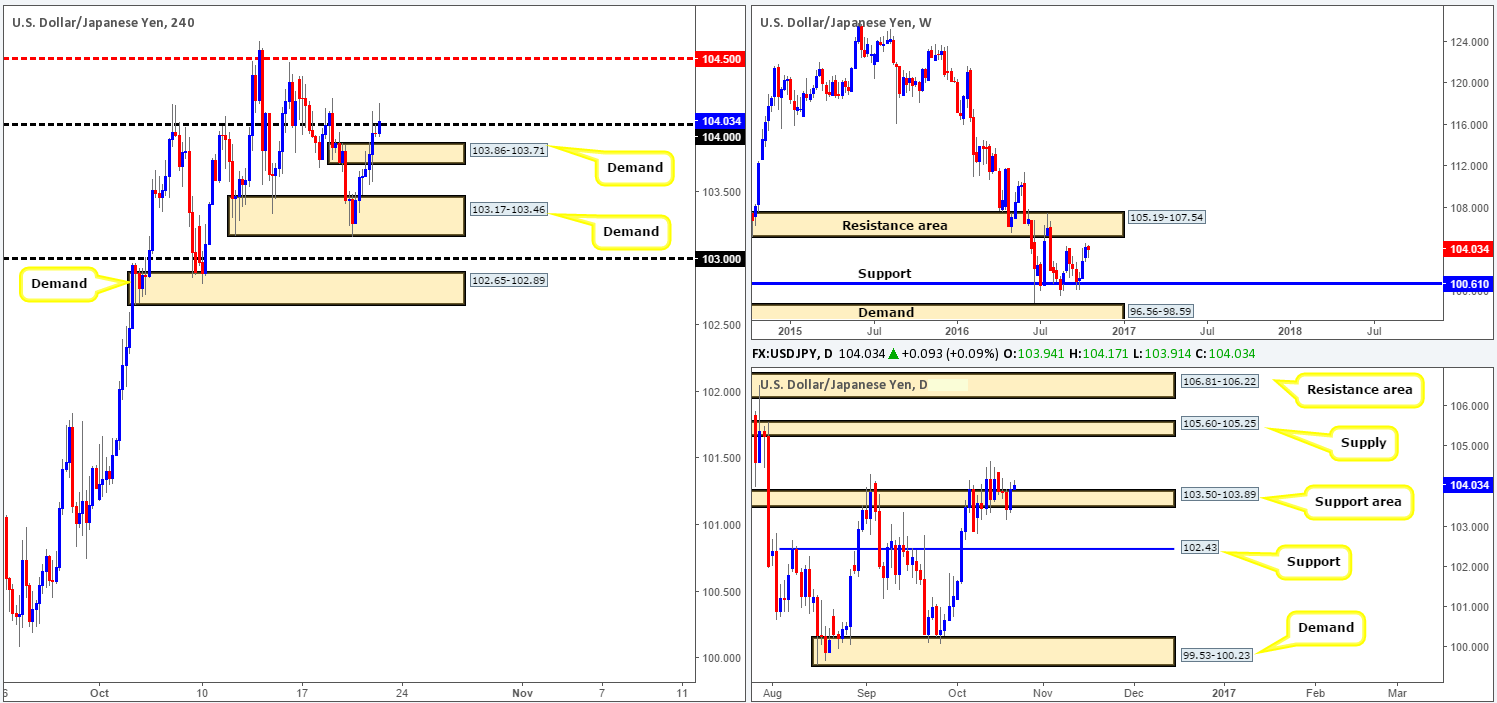
Using a top-down approach this morning, the weekly chart still looks free up to the underside of a nearby resistance area coming in at 105.19-107.54, following its recent breach of highs chalked up on the 29/08 around the 104.32ish range. The story on the daily chart shows that following a slight break below the support area at 103.50-103.89, the pair reversed tracks during yesterday’s session and turned north. A continuation move higher from this angle has the supply zone seen at 105.60-105.25 to target, which, as you can see, is housed within the lower limits of the aforementioned weekly resistance area.
Stepping across to the H4 chart, we can see that the current candle has recently pushed its way above the 104 handle. Assuming that a close above this number takes shape, this would, at least in our opinion, further confirm upside in this market to at least the mid-way resistance hurdle 104.50.
Our suggestions: Following a close above the 104 handle, our team will be watching for a retest of this number as support and a reasonably sized H4 bull candle. This would be sufficient enough to condone a long entry in this market targeting 104.50, followed by the 105 handle as a final take-profit zone. Looking for longs beyond 105 is NOT something we’d recommend as by that point price will be trading within touching distance of both the weekly resistance area and also the daily supply. In fact, this would be an ideal place to be looking to short from!
On the data front, investor focus is now likely on the BOJ Governor Haruhiko Kuroda's speech today, which has no definite release time.
Levels to watch/live orders:
- Buys: Watch for a close above the 104 handle and then look to trade any retest seen thereafter (H4 bullish close required prior to pulling the trigger).
- Sells: Flat (Stop loss: N/A).
USD/CAD:
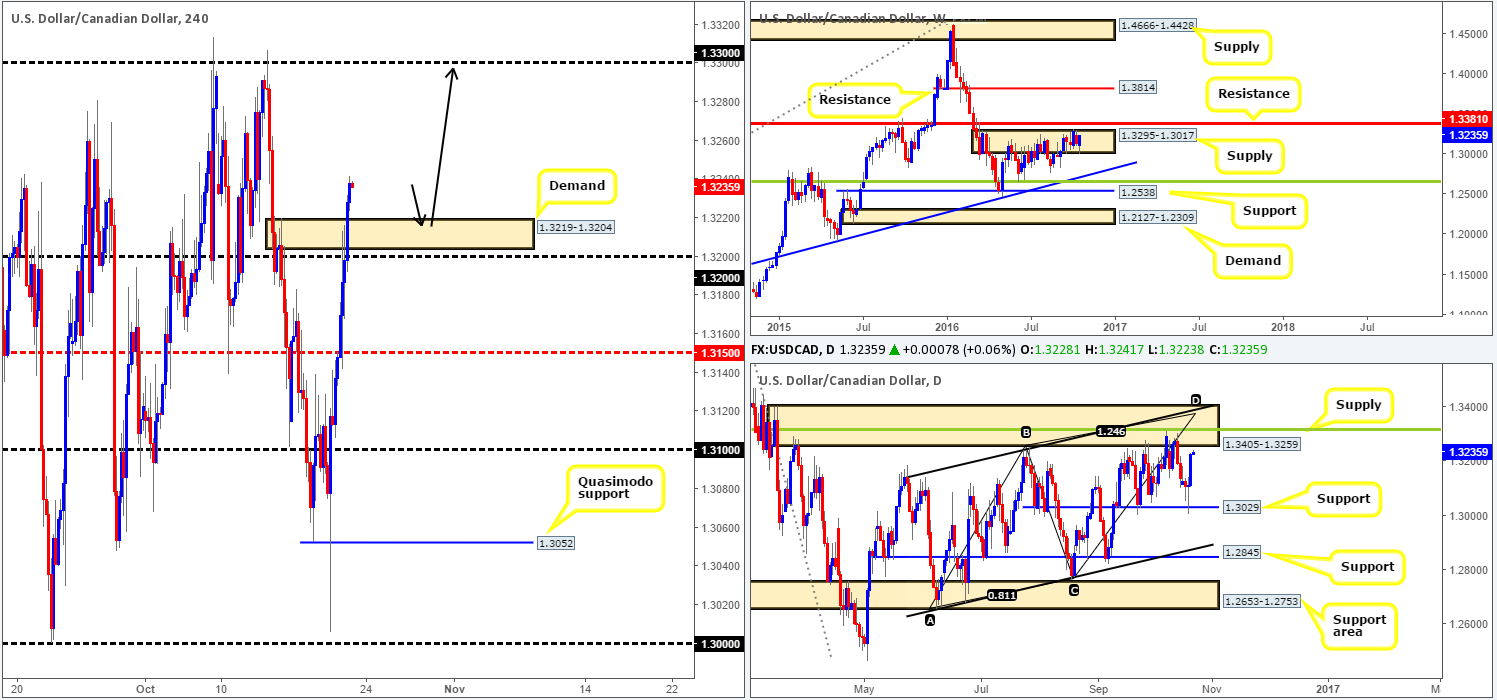
With oil prices softening, the USDCAD pair aggressively pushed higher yesterday, taking out several H4 resistances along the way. H4 supply at 1.3219-1.3204 was the last area to feel the wrath of yesterday’s buying, potentially opening up the gates for price to challenge the 1.33 handle today.
Looking over to the bigger picture, however, the weekly candles remain trading within a supply drawn from 1.3295-1.3017, while daily action is, thanks to yesterday’s buying, now seen trading just ahead of a supply zone coming in at 1.3405-1.3259. Once again, the daily convergence point has been brought back into the spotlight, which is seen housed within the above said daily supply and is made up of the following: a 38.2% Fib resistance level at 1.3315 (green line), the weekly resistance level at 1.3381 (positioned directly above the current weekly supply), a channel resistance taken from the high 1.3241 and an AB=CD completion point around the 1.3376ish range.
Our suggestions: In light of the points made above, we feel the pair will likely continue to advance today, possibly following a retest of the recently broken H4 supply (now acting demand). However, we have no intention to buy from here, simply because of where price is currently positioned on the weekly chart (see above). What we are interested in, nevertheless, is shorting from around 1.3315ish region. Not only does this area boast a truckload of daily/weekly confluence, it also allows one to place their stops above the current daily supply! As a result, our team has a pending sell order set at 1.3315 and a stop placed above at 1.3407.
Data points to consider today are Canadian retail sales along with Canadian CPI data at 12.30pm GMT.
Levels to watch/live orders:
- Buys: Flat (Stop loss: N/A).
- Sells: 1.3315 ([pending order] Stop loss: 1.3407).
USD/CHF:
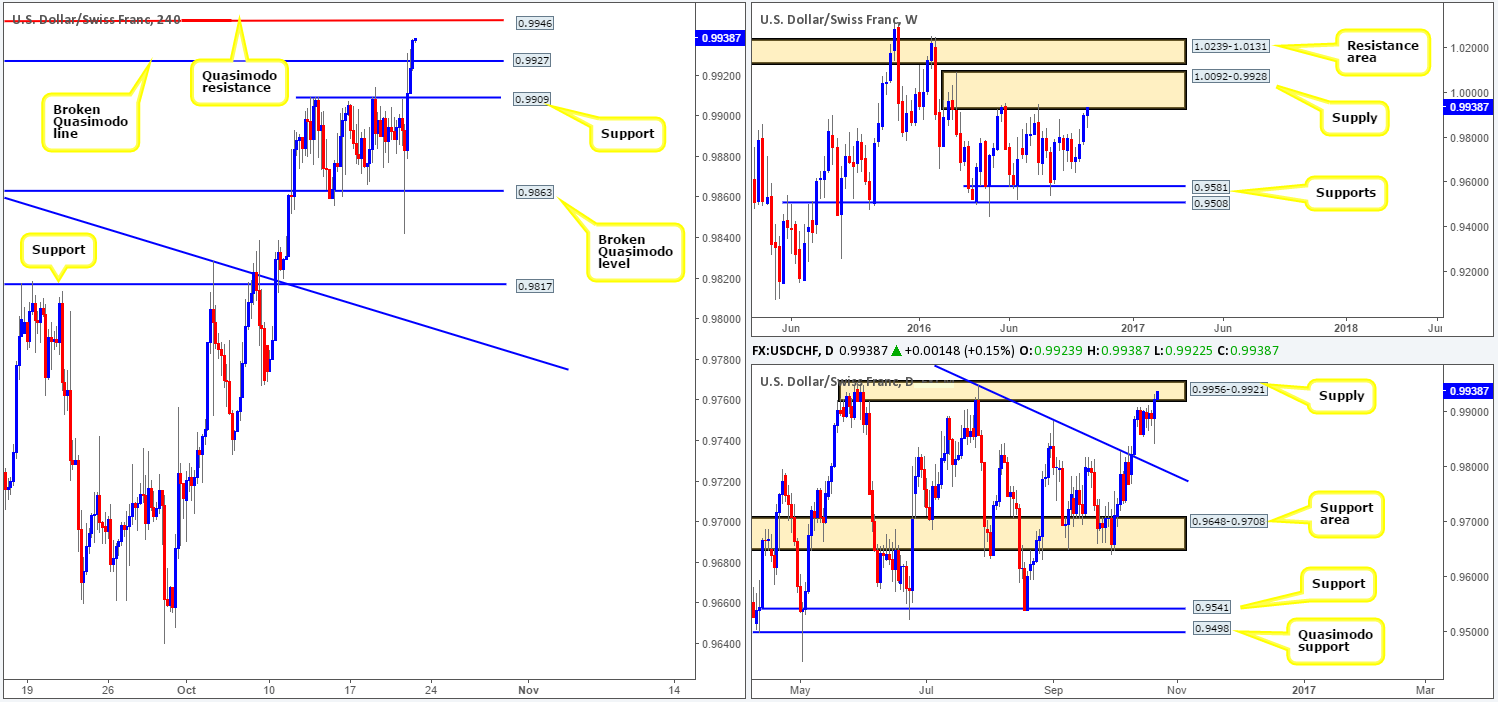
Having seen the EUR/USD pair aggressively tumble lower yesterday, it should not really come as much of surprise to see that the USD/CHF traded higher. For those who follow our reports on a regular basis you may recall that we had a pending sell order placed at 0.9926 with a stop set above the current daily supply base (0.9956-0.9921) at 0.9960. Going into yesterday’s US session, our order, as you can see, was filled and price immediately traded in our favor. As the unit neared the 0.99 handle, our team moved the stop to breakeven, which unfortunately, was later taken out.
On the H4 chart, focus now shifts to the Quasimodo resistance line above at 0.9946. This barrier sits within the lower edge of weekly supply at 1.0092-0.9928, as well as around the top edge of the above noted daily supply. Personally, we believe this H4 Quasimodo has a very good chance of bouncing prices lower today. Furthermore, the stop-distance is relatively small given that we’d look to position it around the same location as our previous short trade: 0.9960 – just above the daily supply zone. With this in mind, a pending sell order has been fixed at 0.9945, targeting the H4 broken Quasimodo line at 0.9927 as a first take-profit target.
Levels to watch/live orders:
- Buys: Flat (Stop loss: N/A).
- Sells: 0.9945 ([pending order] Stop loss: 0.9960).
DOW 30:
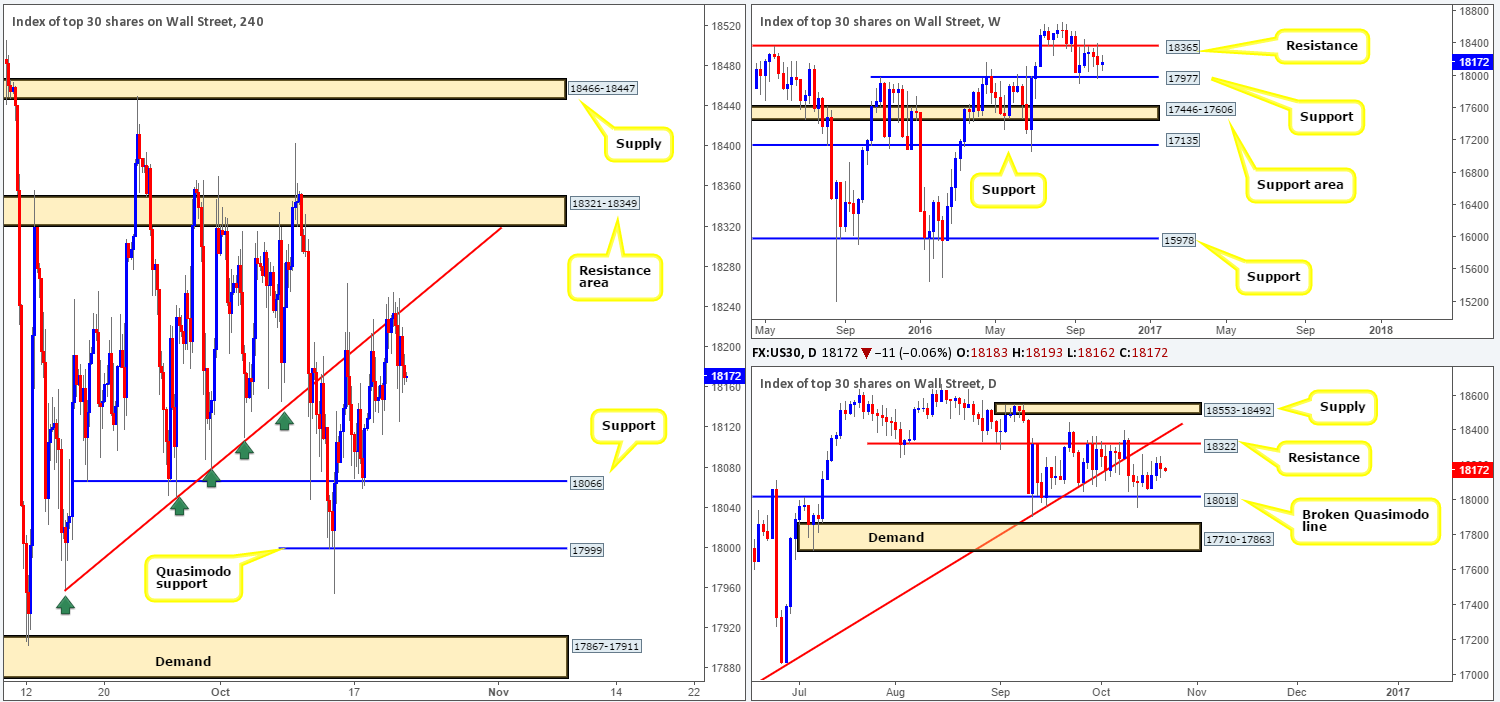
The US equity market, once again, edged lower from the underside of the H4 trendline resistance extended from the low 17959 yesterday, bringing the unit to lows of 18126 on the day. As mentioned in yesterday’s briefing, although this line has provided the market with a reasonable resistance, we do not attach much weight here due to it having little connection with higher-timeframe structures.
Up on the weekly chart, price could essentially move either way as price is currently sandwiched between a resistance drawn from 18365 and a support level coming in at 17977. By the same token, on the daily chart, the DOW is considered, at least by our team, to be trading mid-range between resistance seen at 18322 and a broken Quasimodo line at 18018.
Our suggestions: While we do not expect the following zones to come into play today, they are definitely barriers to keep an eye on next week. As we have mentioned in previous reports, the only areas we have interest in at the moment is the H4 Quasimodo support at 17999 and the H4 resistance area at 18321-18349. The Quasimodo is attractive because it fuses with nearby weekly support at 17977 and also the daily broken Quasimodo line at 18018.The resistance zone, however, is equally attractive since it houses the daily resistance level at 18322 and is located just below weekly resistance at 18365. However, to avoid being stopped out by a whipsaw, we’d recommend waiting for a H4 close prior to risking capital.
Levels to watch/live orders:
- Buys: 17999 ([H4 bullish close required prior to pulling the trigger] Stop loss: ideally beyond the trigger candle).
- Sells: 18321-18349 ([H4 bearish close required prior to pulling the trigger] Stop loss: ideally beyond the trigger candle).
GOLD:
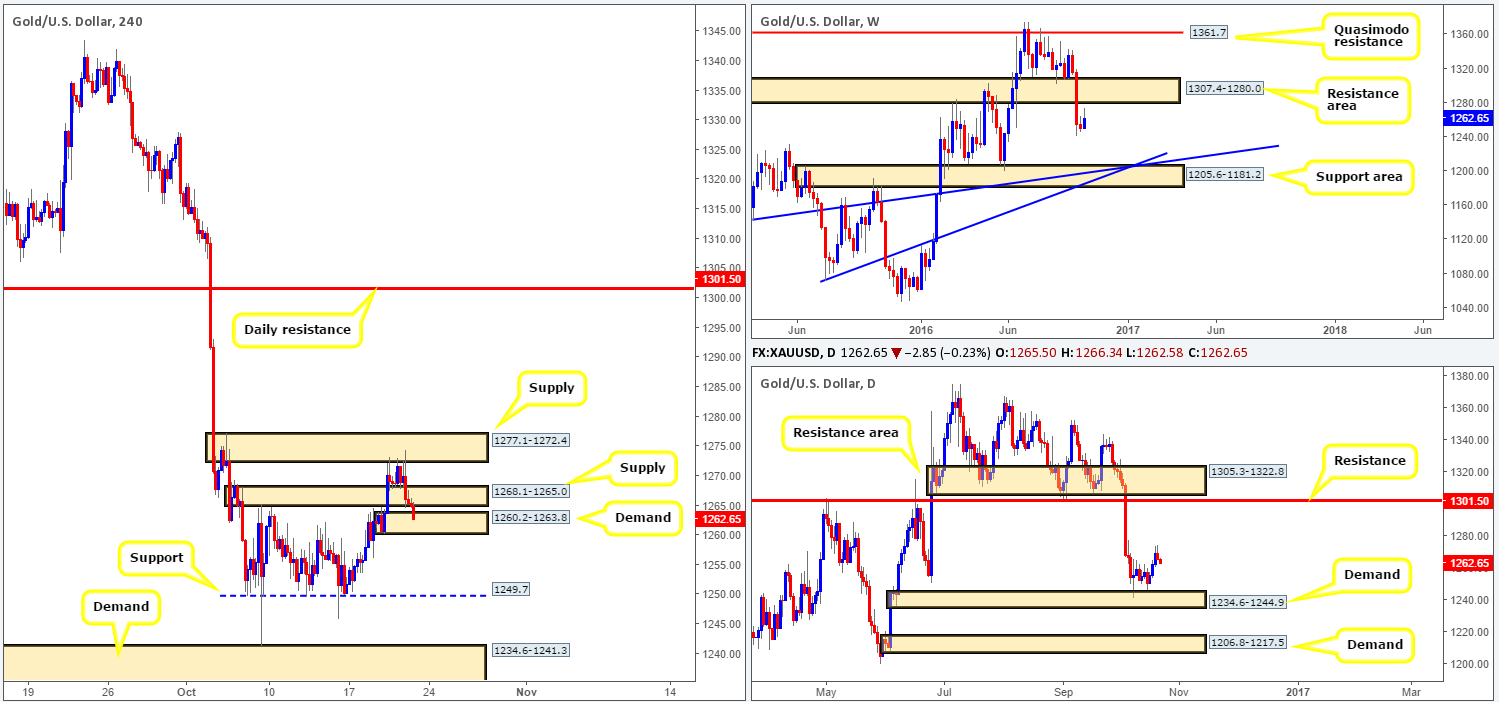
The price of the metal weakened yesterday as the dollar advanced higher against the majority of its major trading partners. As is evident from the H4 chart, supply at 1277.1-1272.4 was enough to suppress the recent three-day Bull Run, and push prices beyond demand carved from 1268.1-1265.0 (now acting supply base). Before the H4 bears can sell, however, nearby demand at 1260.2-1263.8 will need to be taken out, as this would likely free the path south down to support penciled in at 1249.7.
Turning our attention to the bigger picture, unfortunately we do not see much in the way of unity. Daily demand at 1234.6-1244.9 has been holding the market higher since 07/10, while weekly movement looks set to continue lower from current prices.
Our suggestions: For traders who do not require higher-timeframe confluence, a break beyond the current H4 demand base could be considered a bearish cue to either sell the breakout, or conservatively wait for price to retest the underside of the demand as supply, before looking to sell.
If, nevertheless, you’re like us and only favor setups with converging higher-timeframe opinion, you may want to sit on your hands today!
Levels to watch/live orders:
- Buys: Flat (Stop loss: N/A).
- Sells: Flat (Stop loss: N/A).
