Waiting for lower timeframe confirmation is our main tool to confirm strength within higher timeframe zones, and has really been the key to our trading success. It takes a little time to understand the subtle nuances, however, as each trade is never the same, but once you master the rhythm so to speak, you will be saved from countless unnecessary losing trades. The following is a list of what we look for:
- A break/retest of supply or demand dependent on which way you’re trading.
- A trendline break/retest.
- Buying/selling tails/wicks – essentially we look for a cluster of very obvious spikes off of lower timeframe support and resistance levels within the higher timeframe zone.
We typically search for lower-timeframe confirmation between the M15 and H1 timeframes, since most of our higher-timeframe areas begin with the H4. Stops are usually placed 1-3 pips beyond confirming structures.
EUR/USD:
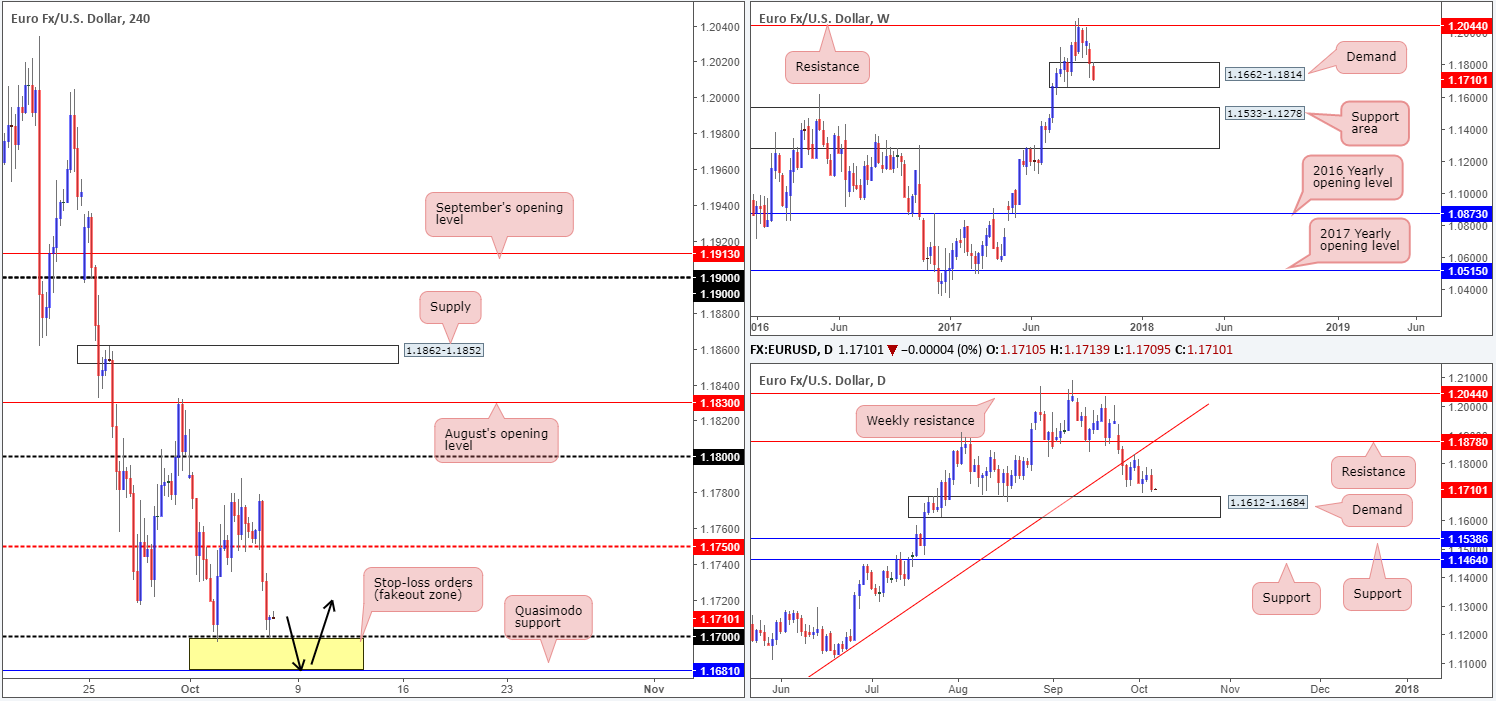
The EUR suffered going into Thursday’s London session, consequently driving through bids at the H4 mid-level support drawn from 1.1750. The unit ended the day approaching the 1.17 handle and formed a H4 buying tail. This, given it formed off of a psychological support, will likely attract buyers into the market.
Sweeping over to the weekly timeframe, demand at 1.1662-1.1814 remains in the crosshairs. As you can see though, the bulls have yet to register anything noteworthy from this region. In the event that this zone eventually gives way, the large support area at 1.1533-1.1278 will be in the spotlight. Meanwhile, down on the daily timeframe, the couple is seen hovering just ahead of demand positioned at 1.1612-1.1684.
Suggestions: Psychological numbers such as our 1.17 level are typically prone to fakeouts due to the amount of orders that these levels attract. In addition to this, the recently formed H4 buying tail has likely increased the orders here as traders will be looking to buy the pin bar. Therefore, the plan is to watch for H4 price to fakeout down to the nearby H4 Quasimodo support level at 1.1681. From our point of view, a buy from 1.1681 is a high-probability setup. Not only because of the truckload of stop-loss orders positioned beneath 1.17, but also because the H4 Quasimodo denotes the top edge of the aforementioned daily demand, as well as being located within the lower limits of the said weekly demand!
Data points to consider: US Employment figures at 1.30pm; FOMC members Dudley and Kaplan take the stage at 5.15pm/5.45pm GMT+1.
Levels to watch/live orders:
- Buys: Watch for H4 price to fake through 1.17 and attack H4 Quasimodo support at 1.1681 (stop loss: either beyond the fakeout candle’s tail or beneath the lower edge of weekly demand at 1.1660).
- Sells: Flat (stop loss: N/A).
GBP/USD:
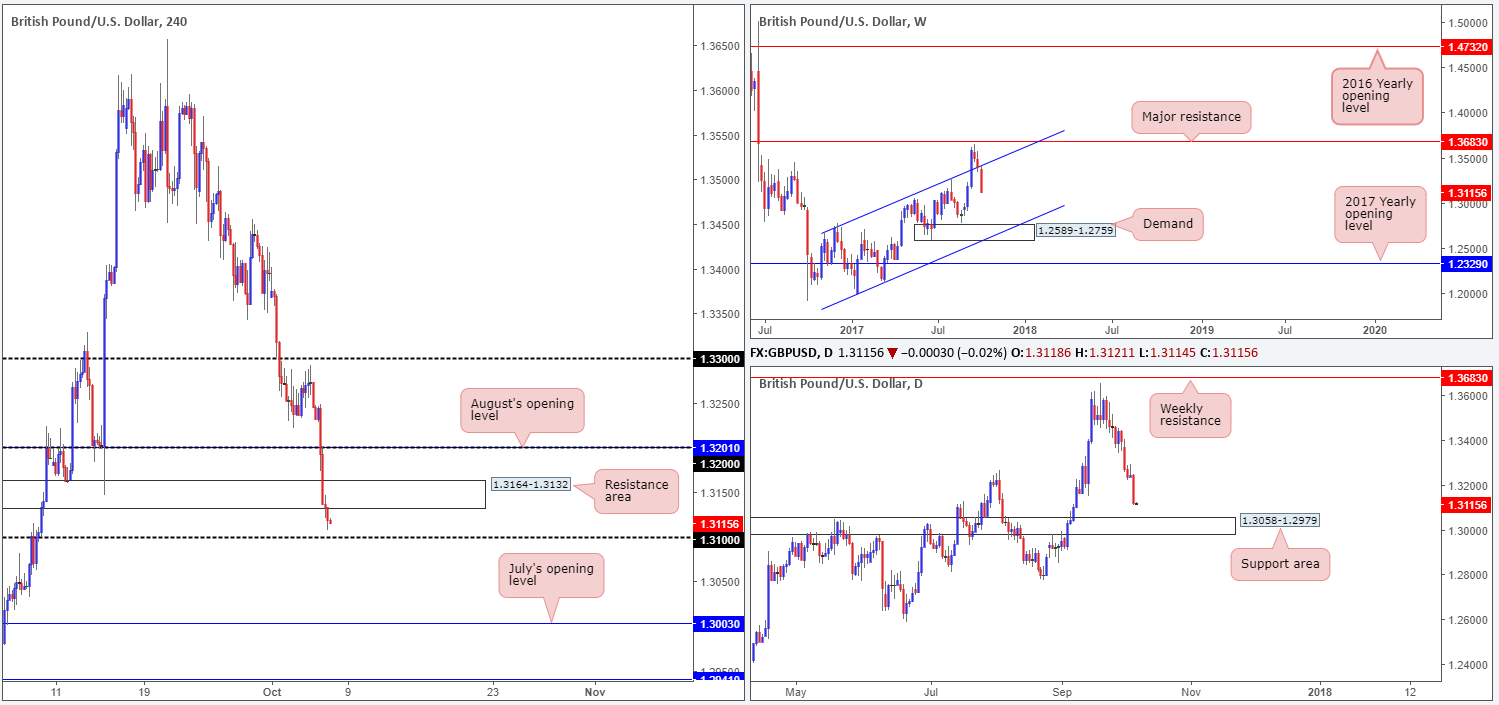
The British pound plunged lower in recent trade, after September’s UK auto sales unexpectedly weakened. H4 price ran through both the 1.32 handle and the H4 support area positioned at 1.3164-1.3132 (now acting resistance zone), leaving the door open to nearby 1.31 support.
A quick look over at the bigger picture shows weekly price recently re-entered the ascending channel formation (1.1986/1.2673). We know there’s a lot of ground to cover here but this move could have potentially opened up downside to as low as the demand area positioned at 1.2589-1.2759. On the flip side, however, daily activity is seen trading within shouting distance of a nice-looking support area marked at 1.3058-1.2979.
Suggestions: Selling this market, although weekly action indicates lower prices could be on the cards, is just too risky for our liking due to 1.31 and the nearby aforesaid daily support area. The same goes for buying. A long from the top edge of the daily support area opens one up to a likely loss given the position of weekly price right now.
For that reason, we’ll remain on the sidelines and wait for further developments.
Data points to consider: MPC member Haldane speaks at 1pm; US Employment figures at 1.30pm; FOMC members Dudley and Kaplan take the stage at 5.15pm/5.45pm GMT+1.
Levels to watch/live orders:
- Buys: Flat (stop loss: N/A).
- Sells: Flat (stop loss: N/A).
AUD/USD:
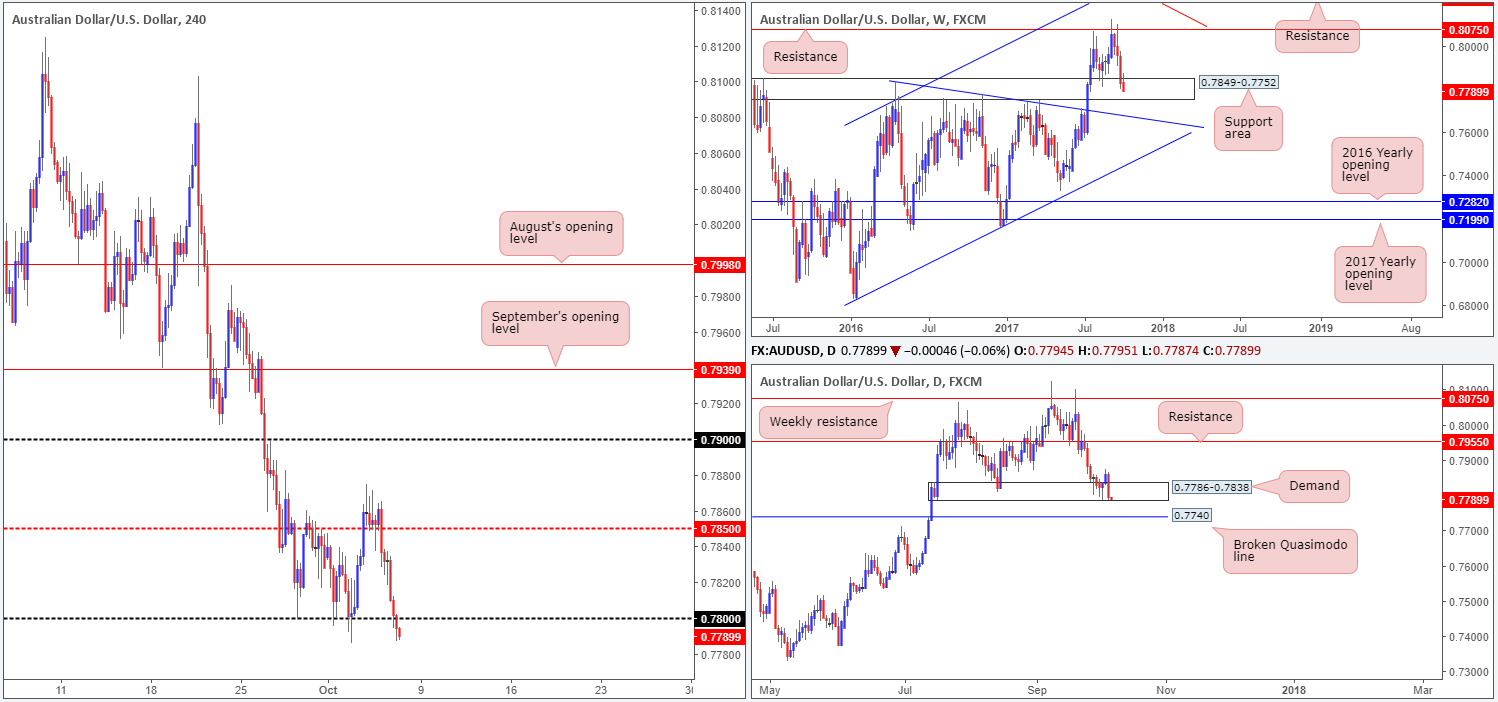
The Australian dollar fell sharply in early trading on Thursday, following a lower-than-expected retail sales print. The pair continued to press south throughout the day, with price concluding trade a few pips beneath the 0.78 handle. Through the lens of a technical trader, the move below 0.78 may have potentially opened up downside to H4 support coming in at 0.7747.
While the H4 candles look poised to extend losses, daily price is seen hanging on by a thread within demand at 0.7786-0.7838. A move below this area will almost immediately place the commodity currency at a broken Quasimodo line etched from 0.7740. Up on the weekly timeframe, the candles remain trading within the walls of a support area at 0.7849-0.7752.
Suggestions: Despite weekly price trading in demand right now, downside momentum looks incredibly strong at the moment. In view of this, we feel the pair will look to press lower and test the H4 support mentioned above at 0.7747, which happens to merge nicely with daily support at 0.7740. As these two levels are positioned around the lower edge of the noted weekly support area, a long trade from here could be an option.
Data points to consider: US Employment figures at 1.30pm; FOMC members Dudley and Kaplan take the stage at 5.15pm/5.45pm GMT+1.
Levels to watch/live orders:
- Buys: 0.7740/0.7747 ([waiting for a reasonably sized H4 bullish candle to form – preferably a full, or near-full-bodied candle – is advised] stop loss: ideally beyond the candle’s tail).
- Sells: Flat (stop loss: N/A).
USD/JPY:
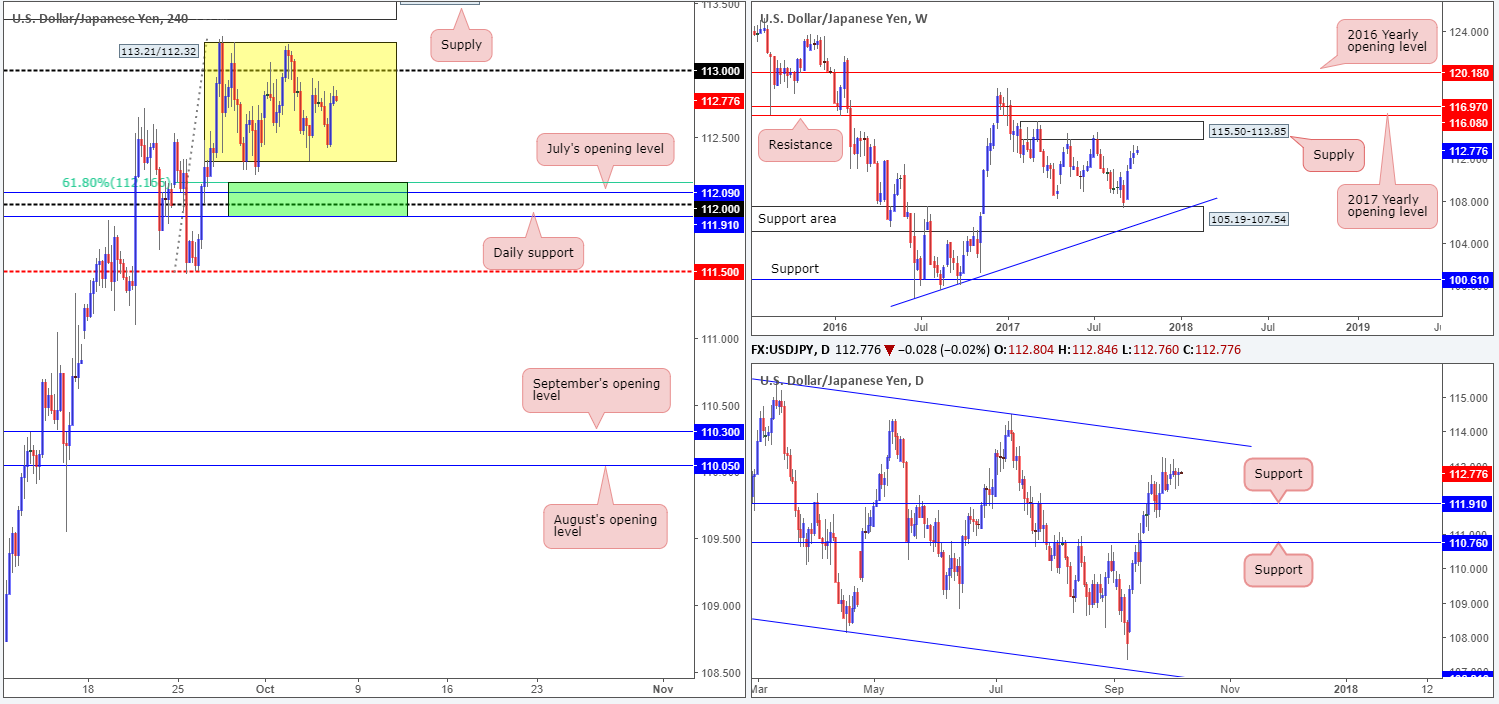
The USD/JPY, as you can see, recently entered into a phase of consolidation between 113.21/112.32 (see yellow box). In spite of this, as we highlighted in Thursday’s report, we maintain a fairly optimistic outlook for the pair overall.
Our reasoning lies within the higher-timeframe structures. Weekly price shows room to push up to nearby supply coming in at 115.50-113.85, as well as daily price up to a trendline resistance extended from the high 115.50, which happens to merge nicely with the noted weekly supply.
In light of the above, we still have an eyeball on the 112 handle for potential longs due to the following confluence:
- Positioned directly above daily support at 111.91.
- Located just below July’s opening level at 112.09.
- Nearby a 61.8% H4 Fib support at 112.16 taken from the low 111.47.
Suggestions: With space seen for both weekly and daily action to push higher, coupled with the 112 handle’s surrounding confluence mentioned above, a long from the green H4 buy zone is still worthy of attention. As psychological levels are prone to fakeouts, however, you may want to wait for H4 price to confirm buyer intent before pulling the trigger. For us, this would simply be a full or near-full-bodied bullish candle formed within the green zone, which would, in our view, provide enough evidence to hold the position up to at least 113/H4 supply at 113.57-113.38.
Later on we have the US job’s report gracing the calendar which could alter the technical structure of this market, so trade safe!
Data points to consider: US Employment figures at 1.30pm; FOMC members Dudley and Kaplan take the stage at 5.15pm/5.45pm GMT+1.
Levels to watch/live orders:
- Buys: 111.91/112.16 ([waiting for a reasonably sized H4 bullish candle to form – preferably a full, or near-full-bodied candle – is advised] stop loss: ideally beyond the candle’s tail).
- Sells: Flat (stop loss: N/A).
USD/CAD:
Trade update: stopped out for a small loss at 1.2503.
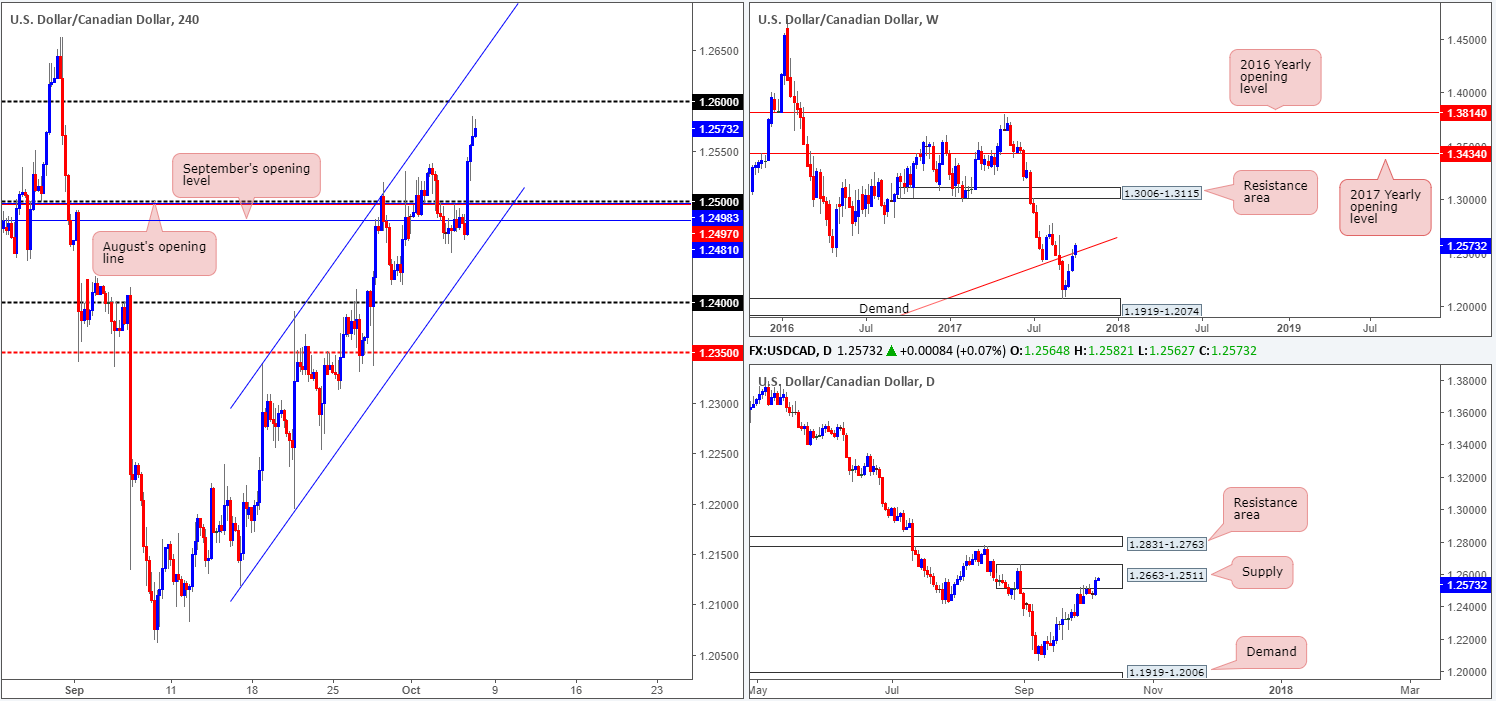
The US dollar pushed aggressively higher against its Canadian counterpart on Thursday, fueled by a wider-than-expected CAD trade deficit and upbeat US unemployment claims. As of current price, the pair is seen lurking just ahead of the 1.26 handle, which is positioned just beneath a H4 channel resistance extended from the high 1.2338.
The daily candles, as you can see, remain fixed within a strong-looking supply at 1.2663-1.2511. Weekly price, however, is currently seen trading above trendline resistance taken from the low 0.9633.
Suggestions: In light of the strong downtrend this pair is in right now, coupled with daily supply, we feel a short trade could be possible from the 1.26 region. With that being said, setting a pending sell order at this line is not something we’d encourage. Instead, you might want to consider waiting for the loonie to strike 1.26 and watch how H4 price action responds. Remember, today we have both Canadian and US employment figures on the docket, which usually forces price into consolidation beforehand!
Data points to consider: US/Canadian Employment figures at 1.30pm; CAD Ivey PMI at 3pm; FOMC members Dudley and Kaplan take the stage at 5.15pm/5.45pm GMT+1.
Levels to watch/live orders:
- Buys: Flat (stop loss: N/A).
- Sells: 1.26 region ([waiting for a reasonably sized H4 bearish candle to form – preferably a full, or near-full-bodied candle – is advised] stop loss: ideally beyond the candle’s wick).
USD/CHF:
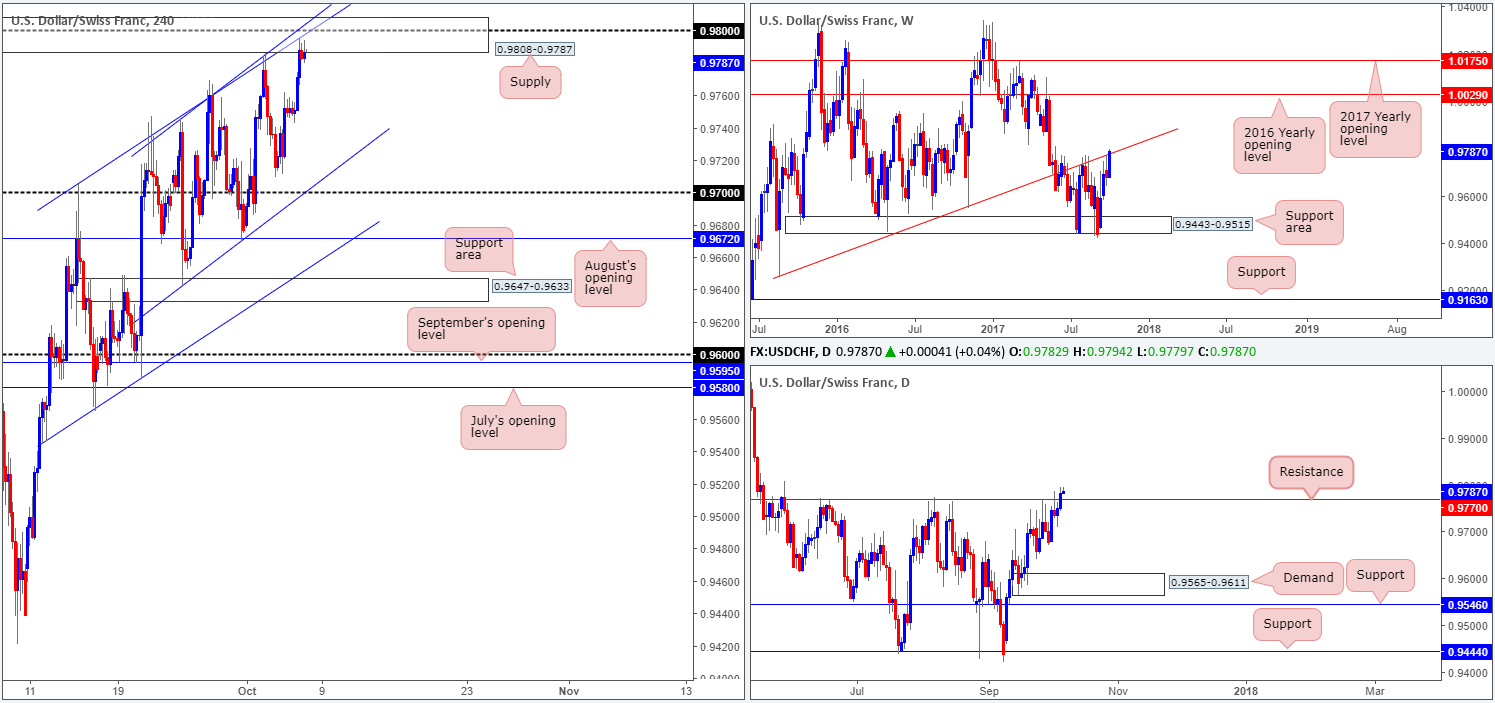
For those who read Thursday’s report you may recall that our desk highlighted a possible sell trade from H4 supply at 0.9808-0.9787 (pending sell order at 0.9790 – stop loss at 0.9810).
Our reasoning behind this trade call was as follows:
- High on the curve, the weekly candles are seen bumping heads with the underside of a trendline resistance extended from the low 0.9257.
- At the time, daily action was trading beneath resistance at 0.9770. Unfortunately price closed above this line during yesterday’s sessions.
- Over on the H4 timeframe, the aforementioned supply is seen converging with the 0.98 handle and two channel resistances etched from highs of 0.9705/0.9746.
Suggestions: Owing to the collective resistances, we entered short at 0.9790 and placed the stop-loss order above the current H4 supply at 0.9810. Ideally, we’re looking for the unit to move down to at least the 0.9750 region as we can then reduce risk to breakeven ahead of today’s US job’s numbers.
Data points to consider: US Employment figures at 1.30pm; FOMC members Dudley and Kaplan take the stage at 5.15pm/5.45pm GMT+1.
Levels to watch/live orders:
- Buys: Flat (stop loss: N/A).
- Sells: 0.9790 ([live] stop loss: 0.9810).
DOW 30:
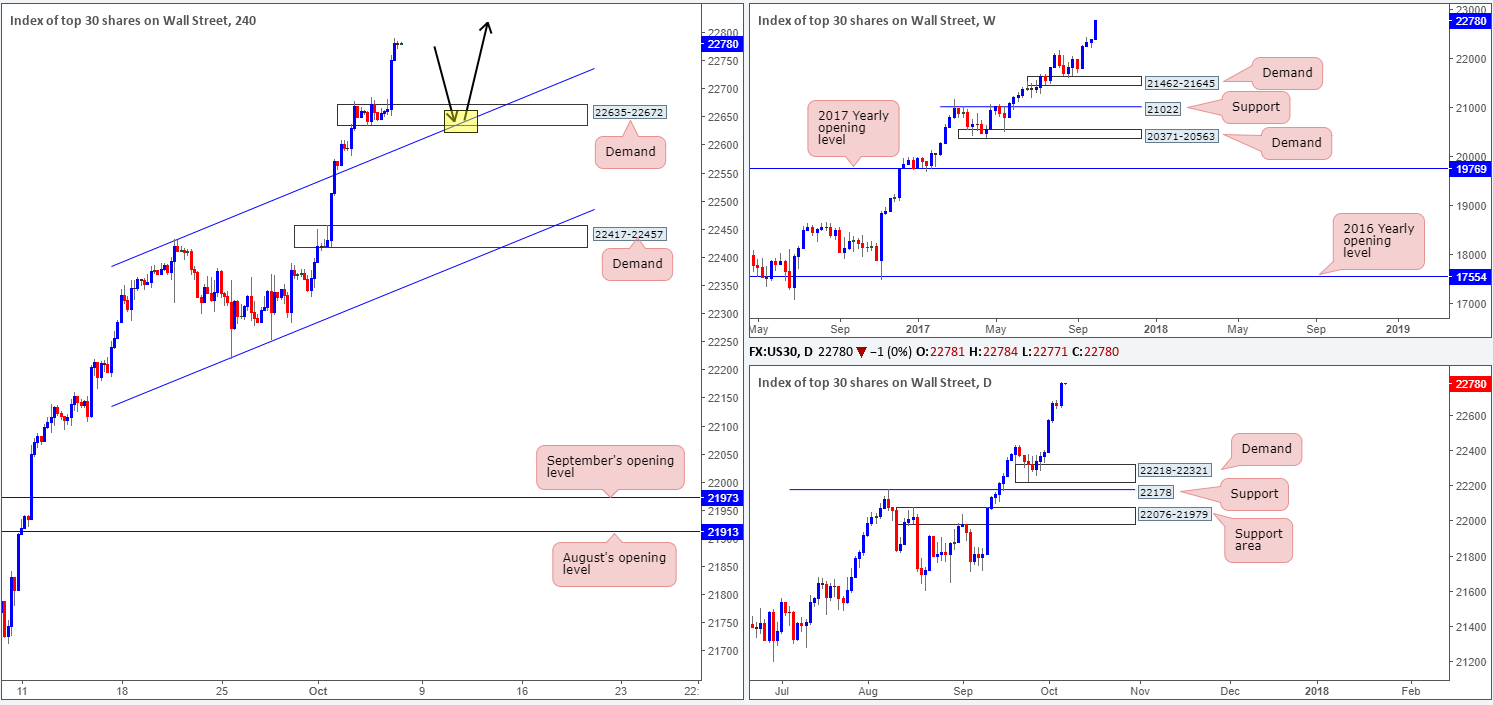
US stocks continued to extend gains on Thursday, recording a fresh record high of 22790. What this recent upside move also did was establish a reasonably strong-looking H4 demand area at 22635-22672, which fuses with a recently broken H4 channel resistance extended from the high 22431 (now acting support).
Suggestions: With the uptrend in this market clearly strong and intact, we’re now looking for H4 price to pullback and connect with the said H4 demand at the point where the H4 channel support converges (yellow marker). Should a reasonably sized H4 bull candle take shape from this area, we would have little hesitation in pulling the trigger here.
Unfortunately, this trade setup will not come into view until early next week so it is one for the watchlist we’re afraid.
Data points to consider: US Employment figures at 1.30pm; FOMC members Dudley and Kaplan take the stage at 5.15pm/5.45pm GMT+1.
Levels to watch/live orders:
- Buys: Watch for H4 price to retest H4 channel support/H4 demand at 22635-22672 ([waiting for a reasonably sized H4 bullish candle to form – preferably a full, or near-full-bodied candle – following the retest is advised] stop loss: ideally beyond the candle’s tail).
- Sells: Flat (stop loss: N/A).
GOLD:
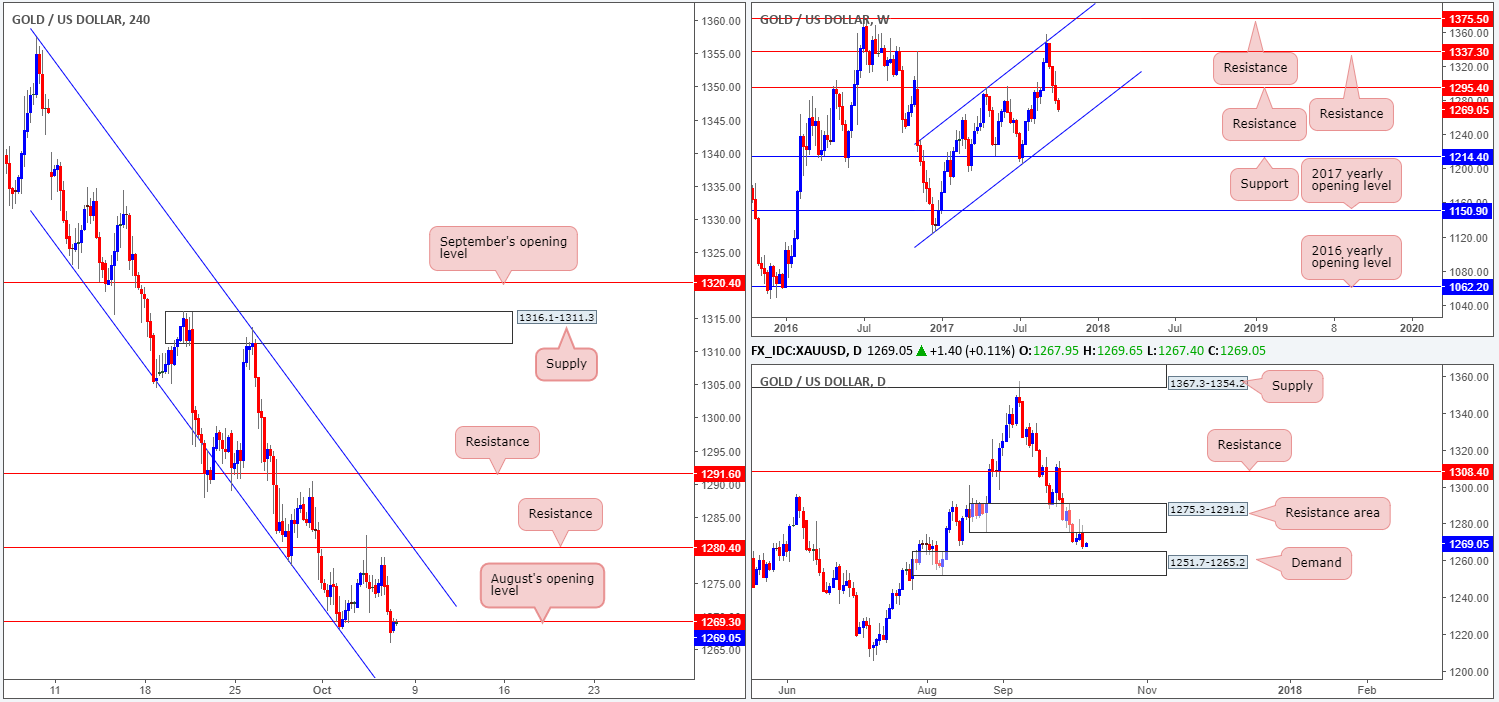
The price of gold came under pressure on Thursday as the US dollar pressed higher. H4 action chomped through August’s opening level at 1269.3 and is, as we write, being retested as resistance. Providing that the bears hold ground here, the next downside target on the H4 scale is support coming in at 1254.3.
Over on the daily timeframe, the resistance area at 1275.3-1291.2 held firm and has pushed price down to within striking distance of demand penciled in at 1251.7-1265.2. Weekly price on the other hand, is showing little support in view until we reach the channel support extended from the low 1122.8.
Suggestions: Given the strong downtrend gold is in right now, we would not be surprised to see August’s opening level hold as resistance. With that being said though, a short trade from this region is a little too risky for our liking since it would entail selling into potential daily buyers from demand (see above).
With US job’s numbers just around the corner, and conflicting signals being seen on the weekly and daily timeframes, we feel the best course of action here is to remain flat and reassess structure post-news.
Levels to watch/live orders:
- Buys: Flat (stop loss: N/A).
- Sells: Flat (stop loss: N/A).
