EUR/USD:
Weekly Gain/Loss: +0.33%
Weekly Close: 1.1557
Weekly perspective:
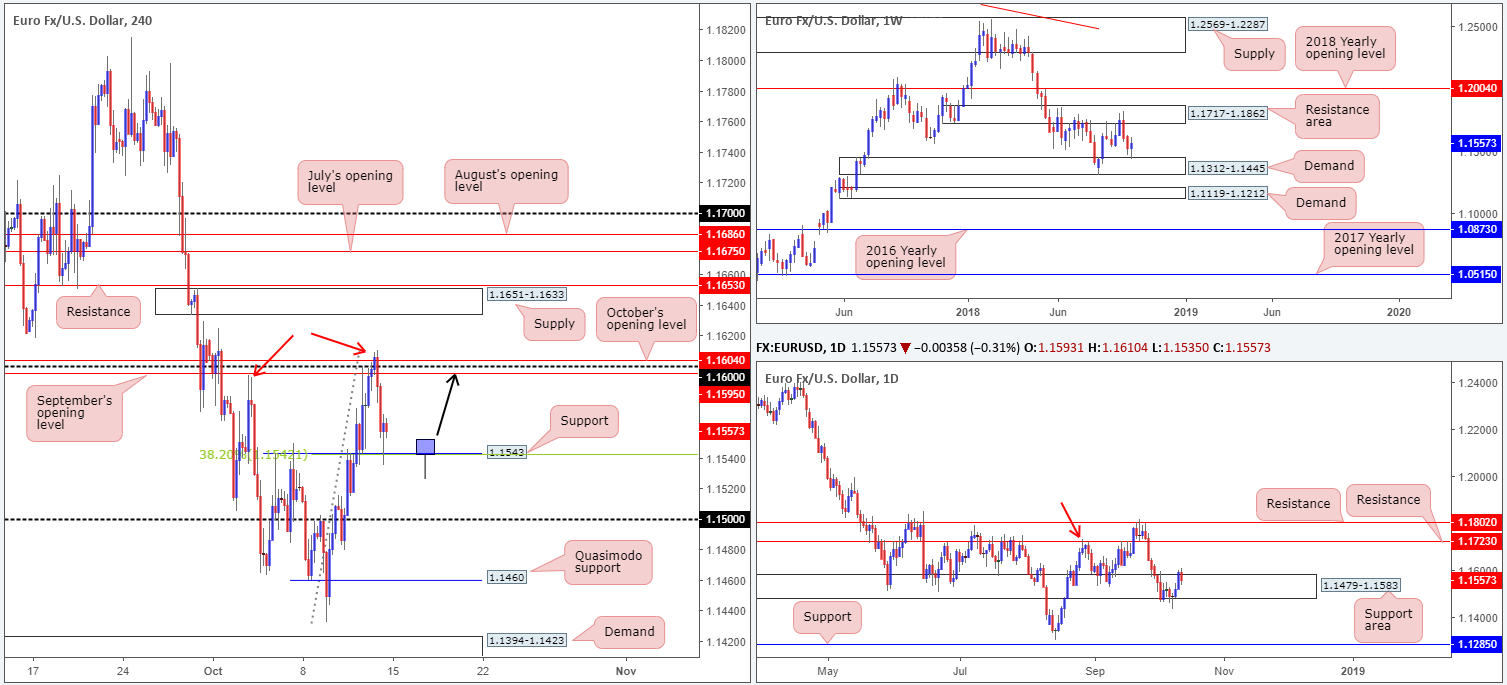
Demand at 1.1312-1.1445 was nudged into the spotlight last week after a two-week bearish stint out of a neighbouring resistance area at 1.1717-1.1862. This, according to our technical reading, is now considered a ranging market on this scale.
Also worth noting is the buyers from 1.1312-1.1445 attacked a large portion of the prior week’s range, though were unable to engulf its high 1.1624.
Daily perspective:
The support area at 1.1479-1.1583, which brings with it a notable history dating back as far as October 2017, suffered a sizable breach to its lower edge in the early stages of last week in the shape of a bullish-pin-bar formation. A resurgence of bidding followed, lifting the action to highs of 1.1610 by the week’s end. The next upside target on this scale can be seen at resistance drawn from 1.1723 (sited within the walls of the noted weekly resistance area, as well as representing a nearby Quasimodo resistance based on the high marked with a red arrow at 1.1733).
H4 perspective:
A quick recap of Friday’s movement on the H4 timeframe points out buyers failed to sustain gains beyond its 1.16 mark and surrounding monthly opening levels from October and September at 1.1604 and 1.1595, respectively. Lack of fundamental drivers paved the way for a USD correction, thus weighing on the single currency.
Retreating from peaks of 1.1610 – after firmly engulfing the October 3 high 1.1593 and creating a firm higher high formation (see red arrows) – the unit found a floor off support at 1.1543 at the closing stages of the week, consequently printing a reasonably eye catching bullish pin-bar formation (unties with a 38.2% Fib support). A breakdown of 1.1543 this week potentially unlocks the door to 1.15, followed closely by a Quasimodo support drawn from 1.1460.
Areas of consideration:
The overall theme of this market is bullish, according to our reading.
Longs from the H4 support at 1.1543 could be an option early week, though a second retest (preferably in the shape of a bullish pin-bar pattern – see chart for a visual representation) would need to be observed in order to achieve reasonable risk/reward to 1.16: the first area of concern.
Today’s data points: US retail sales m/m; US Treasury currency report.
GBP/USD:
Weekly Gain/Loss: +0.26%
Weekly Close: 1.3146
Weekly perspective:
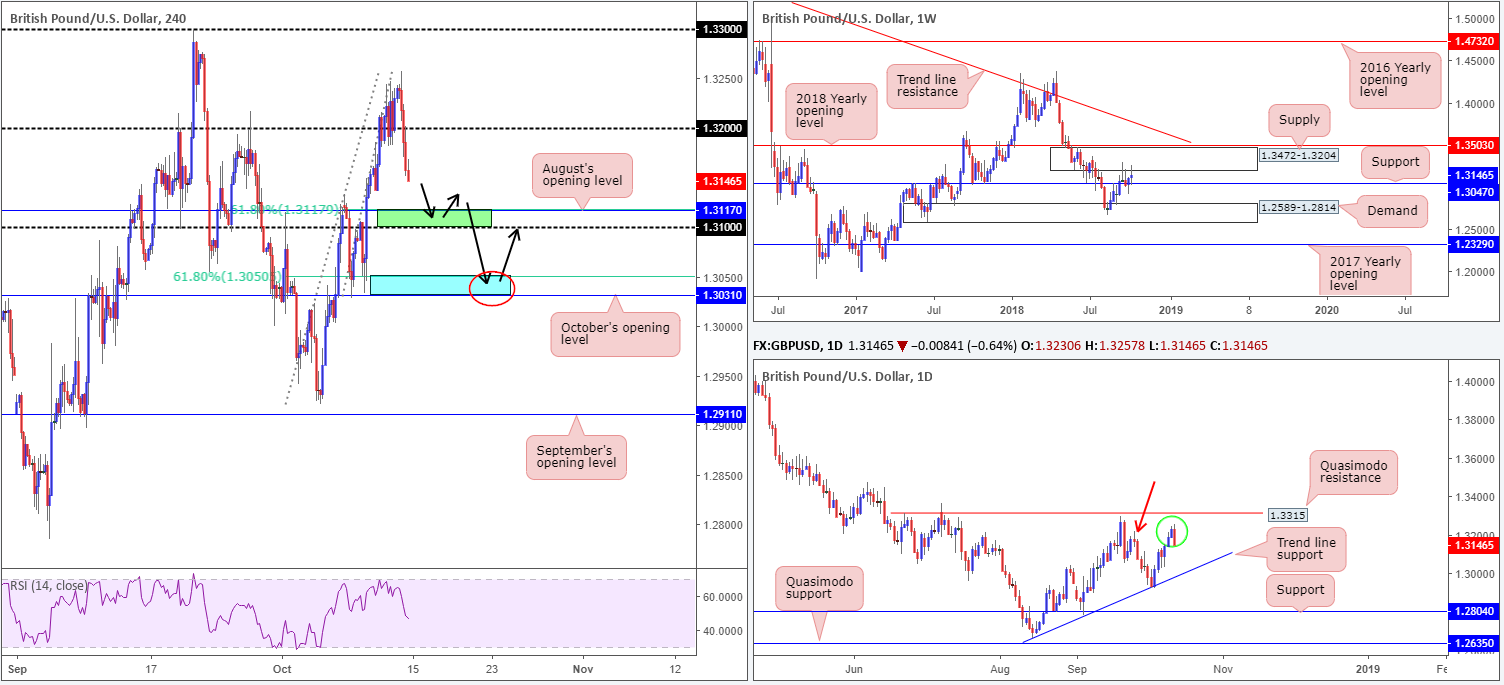
Since mid-September, the British pound has been drifting between notable supply marked at 1.3472-1.3204 and support at 1.3047. Beyond these borders, the 2018 yearly opening level is visible at 1.3503, while to the downside proven demand rests at 1.2589-1.2814.
Daily perspective:
A closer look at price action on the daily chart draws attention to the recent consumption of supply marked with a red arrow at 1.3217-1.3138 in the form of a bearish engulfing pattern (green circle). Combined, this is likely enough, technically that is, to bring the market lower in search of willing buyers from trend line support (extended from the low 1.2661).
H4 perspective:
A modest resurgence of USD longs, along with renewed Brexit uncertainty, is believed to be the key factors behind Friday’s sharp drop from highs of 1.3257.
Aggressively reclaiming its 1.32 handle, the market went on to engulf nearly two days’ worth of gains! In terms of nearby structure, the candles appear poised to challenge August’s opening level at 1.3117 (merges with a 61.8% Fib support) and the nearby 1.31 handle.
Areas of consideration:
On account of Friday’s daily bearish engulfing pattern and room seen to press lower on the daily timeframe, along with weekly price not showing support until 1.3047, buying from 1.31 this week is unlikely to produce much to get excited about, regardless of the additional 61.8% Fib support seen at 1.3117 (green area).
October’s opening level at 1.3031, on the other hand, is considered notable support. Not only does it also converge closely with a 61.8% Fib support of its own at 1.3050, weekly support mentioned above at 1.3047 resides close by, therefore forming a tight, yet high-probability buy zone (blue area), to focus on this week.
Given the area’s small range, however, waiting for additional candlestick confirmation to form before pulling the trigger (a bullish pin-bar pattern or engulfing formation) is recommended. The initial upside target from this blue zone is pegged around the 1.31 mark.
Today’s data points: US retail sales m/m; US Treasury currency report.
AUD/USD:
Weekly Gain/Loss: +0.88%
Weekly Close: 0.7110
Weekly perspective:
Leaving the Quasimodo support at 0.7016 unchallenged, the commodity currency rotated higher last week and held the bulk of its recovery. This comes after shedding nearly 2.5% to fresh yearly lows of 0.7048 the week prior. Continued buying from this point has the 2017 yearly opening level at 0.7199 to target.
Daily perspective:
In terms of where the market stands on the daily chart, the weekly Quasimodo support mentioned above at 0.7016 represents support on this scale, with daily resistance posted above at 0.7151. Beyond 0.7151 supply is visible from 0.7241-0.7205, which happens to tie in nicely with a long-term channel resistance (etched from the high 0.8135)
H4 perspective:
The key observation on the H4 timeframe is Friday’s push above Wednesday’s high at 0.7130 (pink arrow) to 0.7139, coupled with a withdrawal to lows seen just north of the 0.71 handle on the back of USD strength.
As highlighted in Friday’s briefing, H4 technicians likely have the double-bottom pattern at 0.7044 on the radar (red arrows). Given the pattern was confirmed on Friday on the break of 0.7130, traders are either long the breakout now or looking for supportive structure to initiate longs.
Areas of consideration:
Seeing as how we’ve yet to connect with daily resistance at 0.7151, an alternative to simply pressing the buy button on a break of Wednesday’s high 0.7130 is a retest play off 0.71 (blue arrows). This provides traders some breathing space to reduce risk before daily resistance at 0.7151 enters the fold.
Aggressive traders will likely look to trade 0.71 at market with stops positioned 10-15 pips beneath the number, whereas conservative traders may opt to wait and see if additional candlestick confirmation emerges before pulling the trigger (stop/entry levels positioned according to the candle’s structure).
Today’s data points: US retail sales m/m; US Treasury currency report.
USD/JPY:
Weekly Gain/Loss: -1.32%
Weekly Close: 112.20
Weekly perspective:
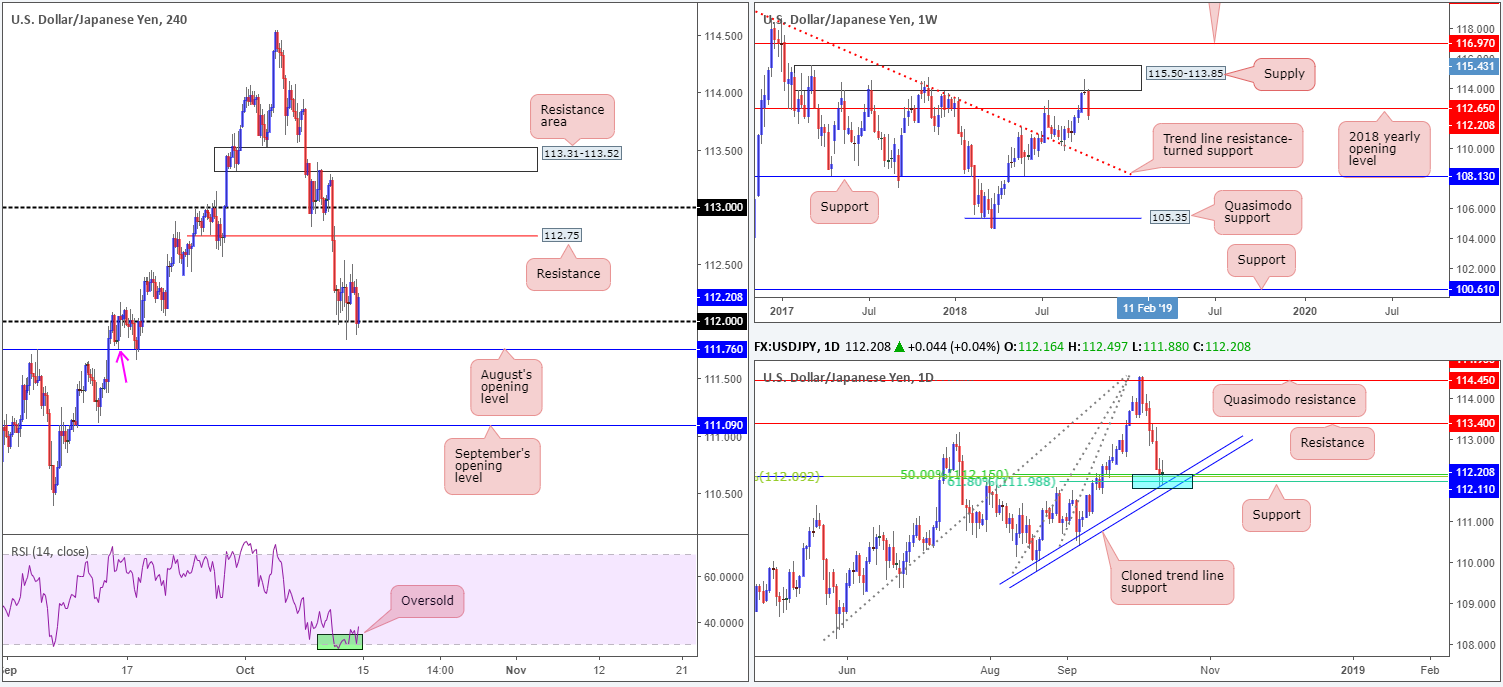
Following the bearish pin-bar pattern off notable supply at 115.50-113.85 the week prior (boasts notable history, capping upside on a number of occasions throughout 2017), the USD/JPY shed 150 pips off its value last week. In addition to this, the unit marginally closed the week out beneath its 2018 yearly opening level at 112.65, perhaps setting the stage for further selling this week in the direction of trend line resistance-turned support (extended from the high 123.57).
Daily perspective:
Indecisiveness was evidently noticeable on the daily timeframe during the later stages of the week, and for good reason! Support at 112.11 brings together an assortment of notable supports: a Fibonacci cluster and a cloned trend line support (taken from the low 109.77). A defensive play from this region may tug price action towards resistance plotted at 113.40.
H4 perspective:
Friday’s movement witnessed intraday action defend 112 territory, likely bolstered by nearby daily support at 112.11, US equities chalking in a rebound and the US dollar index trading firmly above its 95.00 mark.
In the event price continues to grapple with 112, a test of August’s opening level at 111.76 (also happens to signify a Quasimodo support [pink arrow]) could be on the cards. To the upside, however, intraday traders will likely be honing in on 112.50ish, followed by resistance priced in at 112.75.
Areas of consideration:
Overhead pressure from weekly supply at 115.50-113.85 is, technically speaking, possibly the reason behind the tentative buying around the 112 neighborhood.
Despite the above reading, the team feels a recovery towards H4 resistance at 112.75 may be in store, which essentially compares to a retest to the underside of the recently broken 2018 yearly opening level at 112.65. To this end, longs from the 112 mark, with stops tucked beneath August’s opening level at 111.76, could be an option today/early week.
Today’s data points: US retail sales m/m; US Treasury currency report.
USD/CAD:
Weekly Gain/Loss: +0.63%
Weekly Close: 1.3019
Weekly perspective:
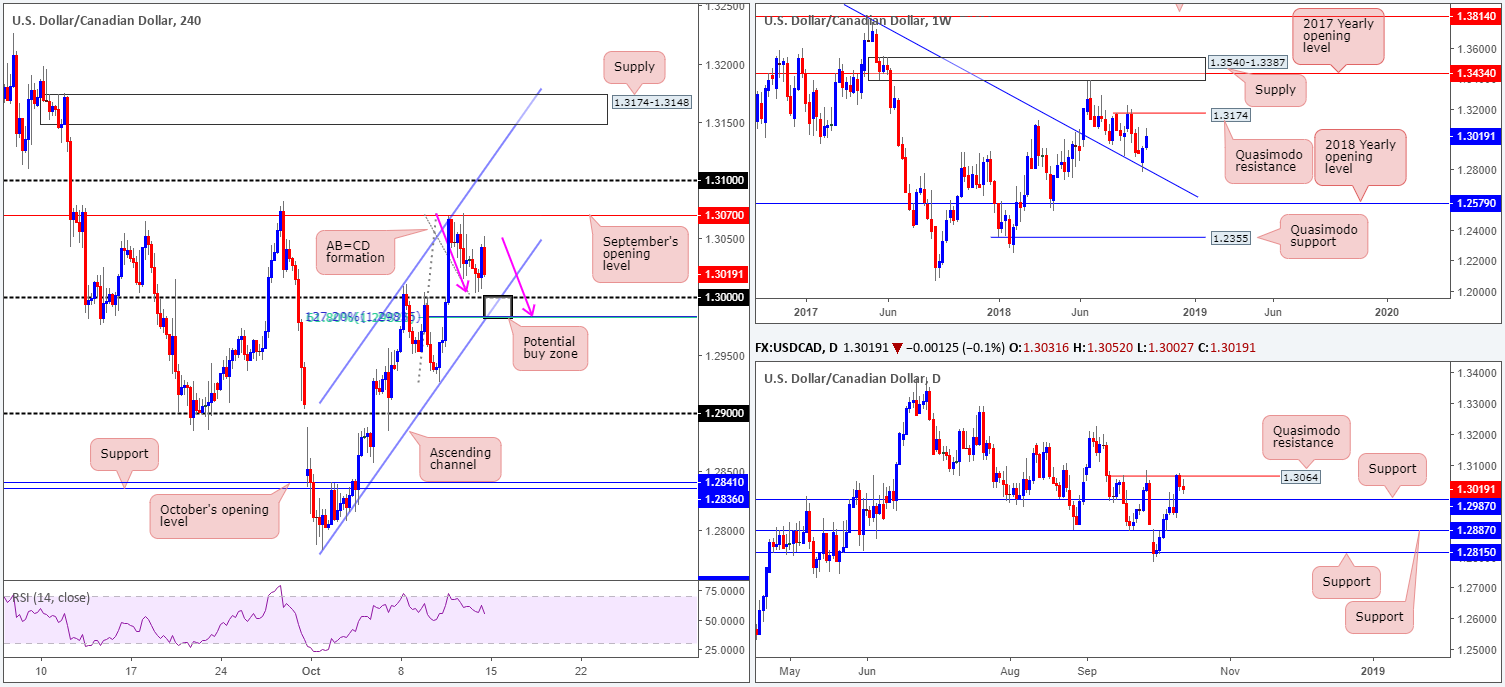
Recent action shows the USD/CAD extended its bounce from trend line resistance-turned support (stretched from the high 1.4689). Having seen the market respond to this barrier in August, and also act as firm resistance from its peak on a number of occasions in the past, the advance should not come as much of a surprise. The next upside target to be aware of, assuming further upside is seen, falls in around a Quasimodo resistance level parked at 1.3174.
Daily perspective:
Quasimodo resistance at 1.3064 was brought into the mix during the later stages of last week, following a strong break of nearby resistance at 1.2987. In view of price holding beneath 1.3064, a retest play at 1.2987 as support may be in the works this week. Traders might also want to note a violation of the current Quasimodo resistance on this scale likely unlocks the gate for weekly buyers to press towards its weekly Quasimodo resistance level mentioned above at 1.3174.
H4 perspective:
Market action was reasonably subdued on Friday, bottoming just north of its key figure 1.30. As a result of this, focus remains on the black zone between 1.2982/1.30, comprised of the following components:
- H4 61.8% Fib support at 1.2982.
- The round number at 1.30.
- Intersecting H4 channel support (taken from the low 1.2782).
- H4 AB=CD (pink arrows) 127.2% (Fibonacci extension) bullish pattern at 1.2983.
In addition to H4 confluence, another key factor present here is the daily support priced in at 1.2987.
Areas of consideration:
A bounce from 1.2982/1.30 by way of a H4 bullish candlestick configuration is, according to our technical studies, enough evidence to validate a long position, targeting daily Quasimodo resistance at 1.3064/September’s opening level at 1.3070 as an initial take-profit zone.
Today’s data points: US retail sales m/m; US Treasury currency report; BoC business outlook survey.
USD/CHF:
Weekly Gain/Loss: +0.01%
Weekly Close: 0.9916
Weekly perspective:
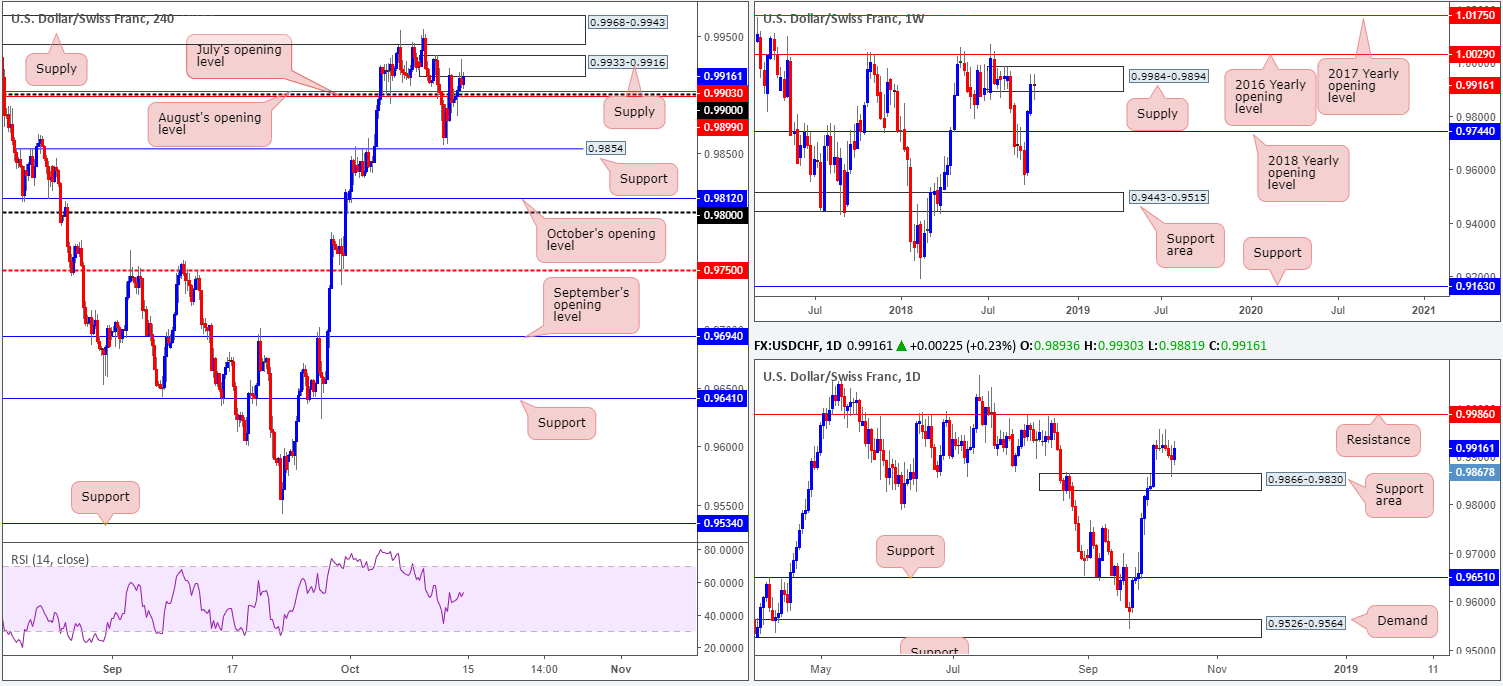
During the course of last week’s sessions, the USD/CHF observed a sharp change in mood after shaking hands with supply presented at 0.9984-0.9894. Although In terms of structure this area claims solid momentum out of its base, which could force a retest of the 2018 yearly opening level at 0.9744, traders may want to pencil in the 2016 yearly opening level at 1.0029 in the event we push for higher ground this week.
Daily perspective:
After producing a number of bearish pin-bar formations off the 0.9955ish region, daily flow declined lower last week and crossed swords with a supply-turned support area coming in at 0.9866-0.9830. Seeing this zone hold ground clearly places a question mark on the weekly supply in play at 0.9984-0.9894.
H4 perspective:
Both supply areas at 0.9968-0.9943 and 0.9933-0.9916 recently held some action, as well as both being housed within the walls of the current weekly supply zone. To the downside on the H4 timeframe, we have the 0.99 handle seen nearby, which happens to be closely associated with July and August’s opening levels at 0.9899 and 0.9903, respectively. A break of this area today/early week will likely place the top edge of the daily support area at 0.9866 back in view, followed closely by H4 support at 0.9854.
Areas of consideration:
Based on the above reading, neither a long nor shorts seems attractive at this point. Aside from weekly/daily structure challenging one another, H4 structure is also incredibly restricted.
Today’s data points: US retail sales m/m; US Treasury currency report.
Dow Jones Industrial Average:
Weekly Gain/Loss: -4.32%
Weekly Close: 25329
Weekly perspective:
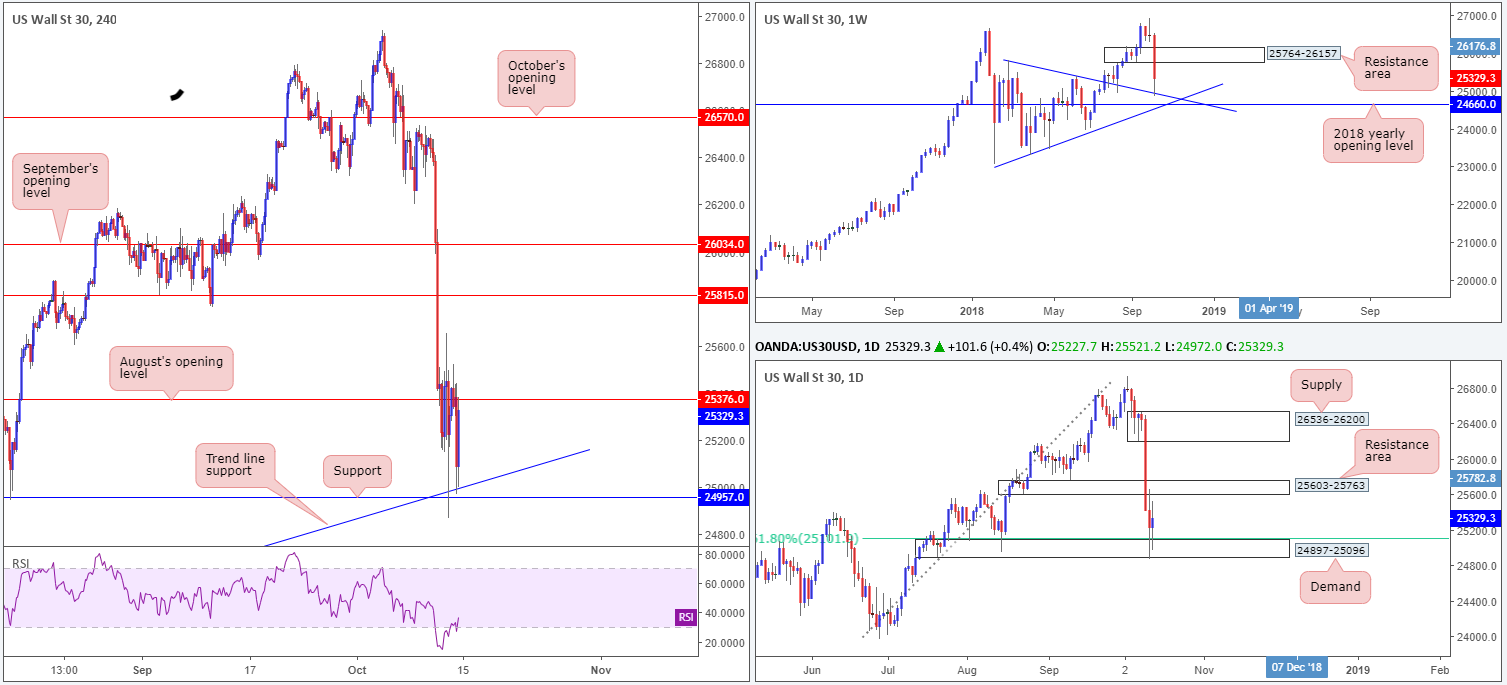
US equities have some real concerns at the moment. Rising interest rates, trade conflict with China and anxieties regarding an ageing bull market saw the Dow Jones Industrial Average shed more than 1100 points last week.
The index demolished demand at 25764-26157 (now an acting resistance area), and ended the week shaking hands with a trend line resistance-turned support (taken from the high 25807), which hovers just north of the 2018 yearly opening level at 24660.
Daily perspective:
A closer look at the action on the daily timeframe brings in demand at 24897-25096 and its nearby 61.8% Fib support at 25101. Although demand suffered a minor breach, the area remains in play with an upside objective located at 25603-25763: a resistance area.
H4 perspective:
H4 movement also checked in with support penciled in at 24957 (situated within the lower limits of the current daily demand zone) and a merging trend line support (etched from the low 23451) in the later stages of last week. The next upside target on this scale, however, is seen close by at 25376: August’s opening level.
Areas of consideration:
From a technical perspective, having seen all three timeframes engage with supportive structure, a break of August’s opening level at 25376 is eyed. Should this come to fruition and the H4 candles retest 25376 as support in the shape of a bullish candlestick formation (stop/entry parameters should be based on this pattern), longs are high probability with an initial upside target priced in at 25603: the underside of the daily resistance area.
Today’s data points: US retail sales m/m; US Treasury currency report.
XAU/USD (Gold)
Weekly Gain/Loss: +1.11%
Weekly Close: 1216.6
Weekly perspective:
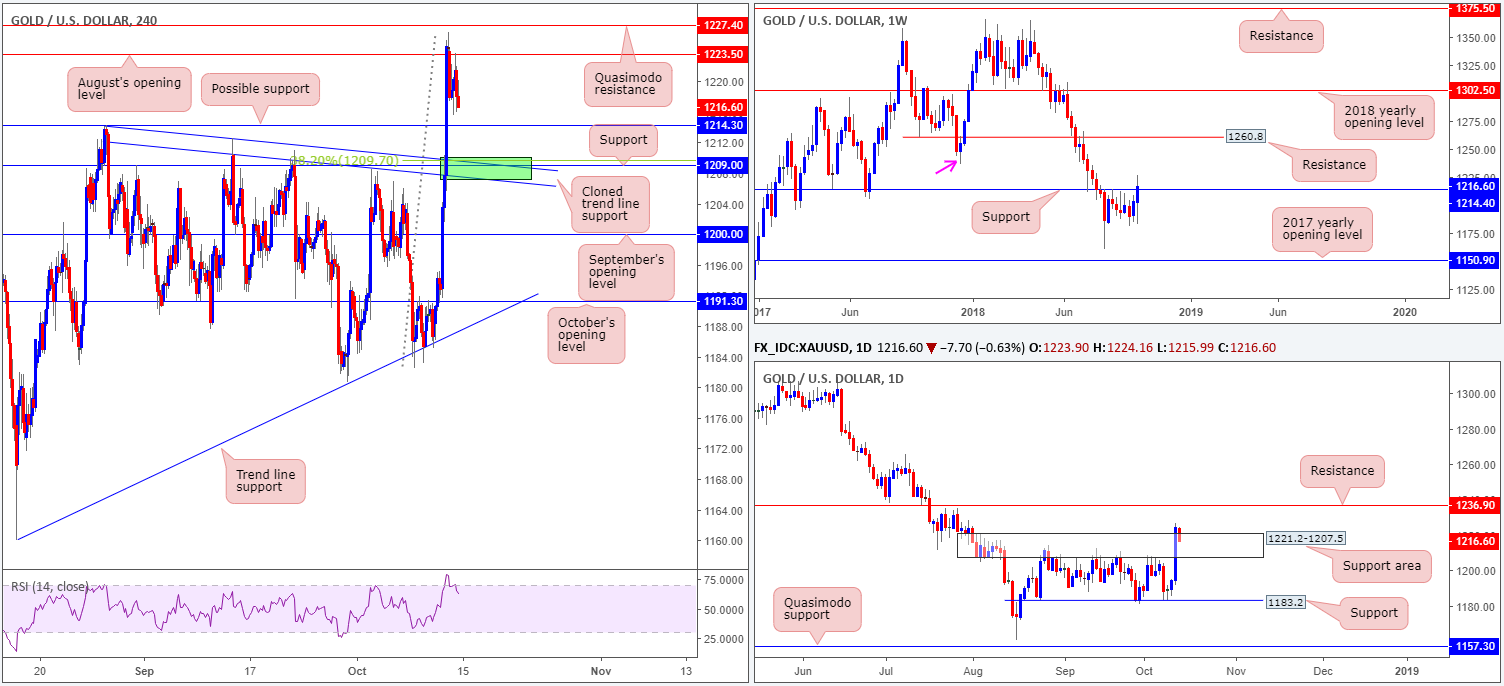
After seven weeks of mundane consolidation beneath a key resistance level coming in at 1214.4, the price of gold transitioned into positive territory last week, reaching highs of 1226.4.
The mild break of resistance (now an acting support) has potentially fixed the stage for further upside this week. Swing resistance is evident at 1236.6 (pink arrow), though the majority of eyes are likely honed in on resistance chiseled in at 1260.8.
Daily perspective:
Supply at 1221.2-1207.5 (now acting support area) was aggressively taken out on Thursday, likely tripping a truckload of stop-loss orders from those short and also filling breakout buyers’ orders. Overhead, the pathway north appears relatively free towards resistance plotted at 1236.9, which is essentially the swing point on the weekly scale at 1236.6.
H4 perspective:
Friday’s session was somewhat subdued as bullion met selling pressure around the underside of August’s opening level at 1223.5. In terms of structure, little has changed as far as our outlook goes.
Possible support at 1214.3 (August 28 high) could emerge today and bolster price action, though the more resilient support appears to be priced in a little lower on the curve at 1209.0 (intersects with a cloned trend line resistance-turned support taken from the high 1214.3 and a 38.2% Fib support at 1209.7 – green zone).
Areas of consideration:
H4 support mentioned above at 1209.0, along with its converging cloned trend line resistance-turned support and 38.2% Fibonacci value, is an area worthy of attention for possible longs. A bounce from here in the form of a bullish candlestick pattern (stop/entry parameters best taken from this structure), either on the H1 or H4, has an initial target set at daily resistance drawn from 1236.9, followed then by an ultimate target positioned on the weekly timeframe at 1260.8.
From 1209.0, resistances at 1214.3/1223.5/1227.4 should also be taken into consideration as possible areas sellers may enter the market from, though higher-timeframe flow will likely eventually pull price beyond these points.
The use of the site is agreement that the site is for informational and educational purposes only and does not constitute advice in any form in the furtherance of any trade or trading decisions.
The accuracy, completeness and timeliness of the information contained on this site cannot be guaranteed. IC Markets does not warranty, guarantee or make any representations, or assume any liability with regard to financial results based on the use of the information in the site.
News, views, opinions, recommendations and other information obtained from sources outside of www.icmarkets.com.au, used in this site are believed to be reliable, but we cannot guarantee their accuracy or completeness. All such information is subject to change at any time without notice. IC Markets assumes no responsibility for the content of any linked site. The fact that such links may exist does not indicate approval or endorsement of any material contained on any linked site.
IC Markets is not liable for any harm caused by the transmission, through accessing the services or information on this site, of a computer virus, or other computer code or programming device that might be used to access, delete, damage, disable, disrupt or otherwise impede in any manner, the operation of the site or of any user’s software, hardware, data or property.
