A note on lower timeframe confirming price action…
Waiting for lower timeframe confirmation is our main tool to confirm strength within higher timeframe zones, and has really been the key to our trading success. It takes a little time to understand the subtle nuances, however, as each trade is never the same, but once you master the rhythm so to speak, you will be saved from countless unnecessary losing trades. The following is a list of what we look for:
- A break/retest of supply or demand dependent on which way you’re trading.
- A trendline break/retest.
- Buying/selling tails/wicks – essentially we look for a cluster of very obvious spikes off of lower timeframe support and resistance levels within the higher timeframe zone.
- Candlestick patterns. We tend to only stick with pin bars and engulfing bars as these have proven to be the most effective.
We search for lower timeframe confirmation between the M15 the H1 timeframes, since most of our higher-timeframe areas begin with the H4. Stops are usually placed 5-10 pips beyond confirming structures.
EUR/USD:
Weekly gain/loss: + 27 pips
Weekly closing price: 1.1273
Weekly opening price: 1.1331
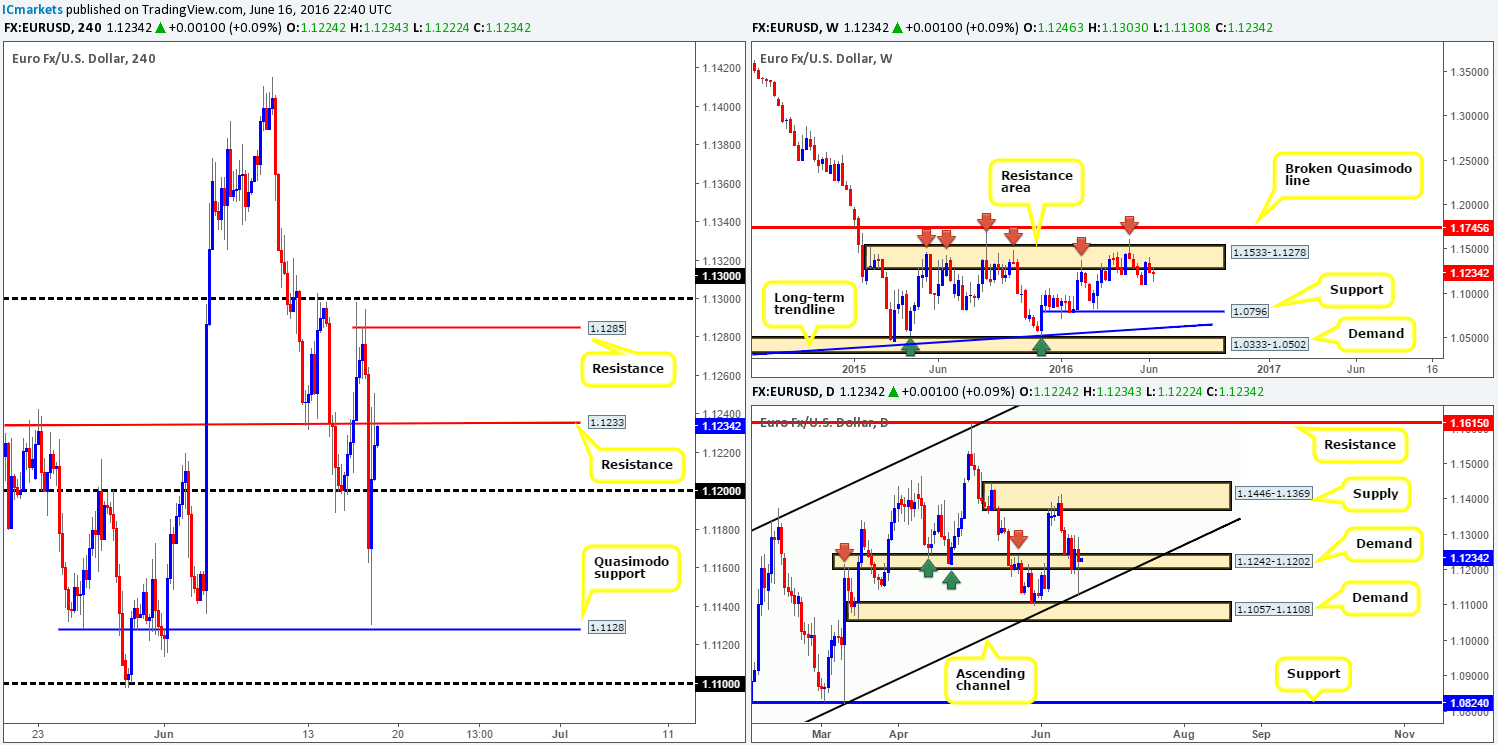
Weekly view: As can be seen from the weekly chart this morning, the shared currency has been trading around the underside of a weekly resistance area at 1.1533-1.1278 since Mid-march. Taking into consideration that this zone has primarily capped upside since May 2015 (see red arrows), we feel that price will eventually touch base with weekly support penciled in at 1.0796 in the near future.
Daily view: Moving down to the daily chart, we can see that the EUR is now seen trading mid-range between a daily supply seen at 1.1446-1.1369 and daily demand drawn from 1.1242-1.1202 (positioned within the above said weekly resistance area).
H4 view: A quick recap of Friday’s trade on the H4 shows that the single currency retested H4 supply given at 1.1303-1.1287, which, as you can see, held price lower into the close. Things look a little different this morning, however, as price gapped a whopping sixty pips north and now trades at around the 1.1320 mark. Technically, our team is expecting the weekend gap to be filled today which will bring this market back down into the jaws of H4 supply-turned demand (mentioned above).
Our suggestions: Watch lower timeframe action around the aforementioned H4 demand base today. This (green arrows) – coupled with a reasonable lower timeframe entry (see the top of this article for ideas on how to find a lower timeframe entry) would be enough to justify a trade long from this boundary, with a target objective seen at 1.1410/1.1392 (H4 Quasimodo resistance lines – located within the above said daily supply as well as the weekly resistance area). The reason for requiring lower timeframe confirmation here guys comes down to this unit still residing within the weekly resistance area we discussed above.
Assuming the above comes to fruition, shorting at market from 1.1410/1.1392 region is certainly a possibility this week due to where both lines are seen located on the higher timeframe picture (see above). It will be interesting to see how this week pans out especially since the EU referendum results are now just around the corner!
Levels to watch/live orders:
- Buys: 1.1303-1.1287 [Tentative – confirmation required] (Stop loss: dependent on where one confirms this area).
- Sells: 1.1410/1.1392 region.
GBP/USD:
Weekly gain/loss: + 96 pips
Weekly closing price: 1.4346
Weekly opening price: 1.4457
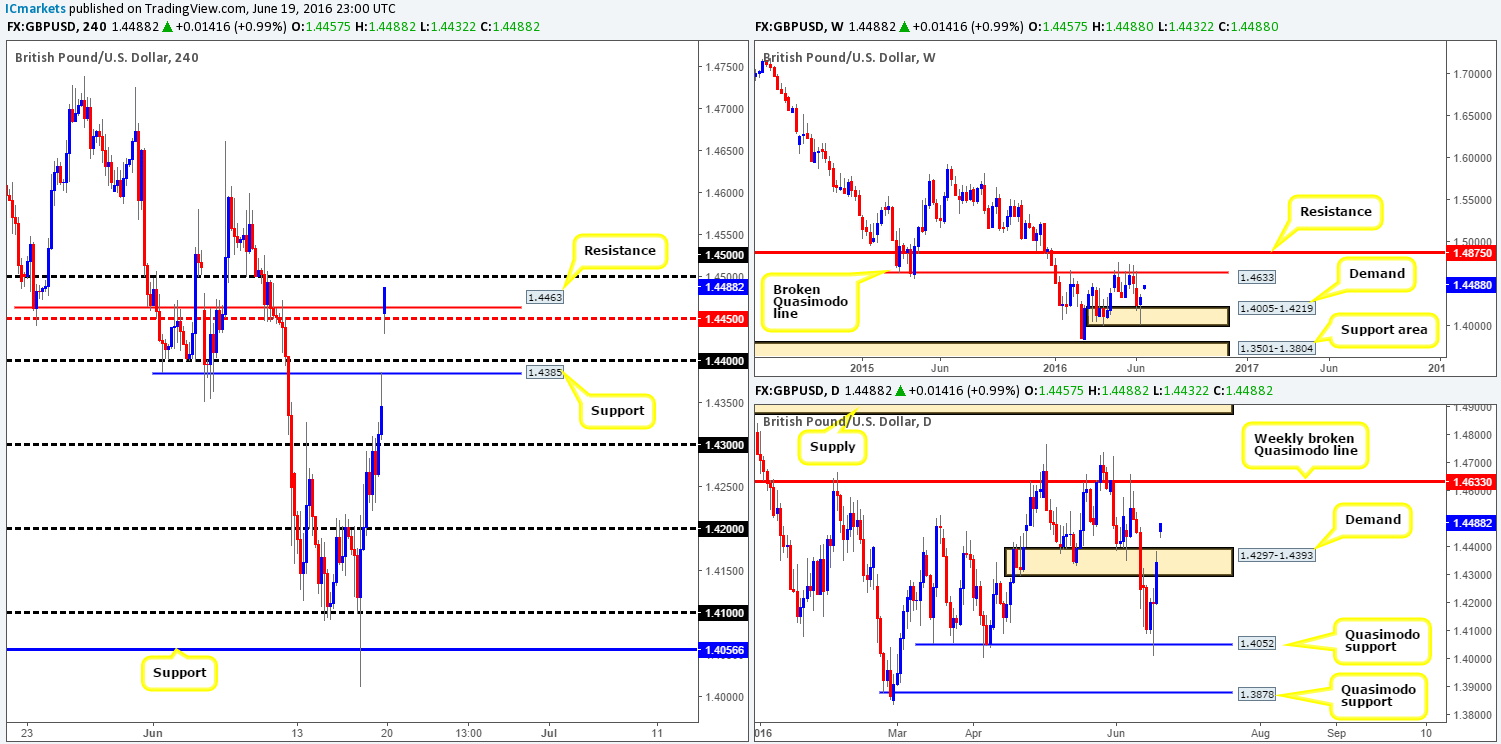
Weekly view: Last week’s action, as can be seen from the weekly chart, saw the GBP recover from deep within weekly demand logged in at 1.4005-1.4219, eventually chiseling out a nice-looking weekly buying tail! Technically, the next upside target on this scale can be seen around 1.4633 – a weekly broken Quasimodo line. Therefore, it may be an idea to take note of this level as it may come into view sometime this week.
Daily view: Consequent to a monster gap north this morning, cable is now seen trading above daily supply at 1.4297-1.4393 which will now likely form a demand for price to work with. On the assumption that this daily area does indeed become demand, we see little stopping this pair from reaching the aforementioned weekly broken Quasimodo line this week.
H4 view: Over on the H4, the pound started the day at 1.4457, a whopping 111 pips higher than Friday’s close, which came after a strong push north following the UK Prime Minister suspending the current campaign due to the death of British lawmaker MP Jo Cox.
In view of price now flirting with H4 resistance at 1.4463, where does our team go from here? Well, higher timeframe technicals indicate that this pair may want to strike higher prices this week, assuming daily demand at 1.4297-1.4393 holds ground. However, with the 1.45 handle lurking just above a long from 1.4463 is difficult!
Our suggestions: We’re very hesitant trading EUR and GBP pairs this week due to the EU referendum so close to finalizing. High volatility is expected throughout the week and as such technical setups become extremely vulnerable. Given the H4 structure (see above), our team has come to a general consensus that remaining on the sidelines today, especially after such a strong weekend gap, may be the best path to take today…
Levels to watch/live orders:
- Buys: Flat (Stop loss: N/A).
- Sells: Flat (Stop loss: N/A).
AUD/USD:
Weekly gain/loss: + 24 pips
Weekly closing price: 0.7395
Weekly opening price: 0.7430
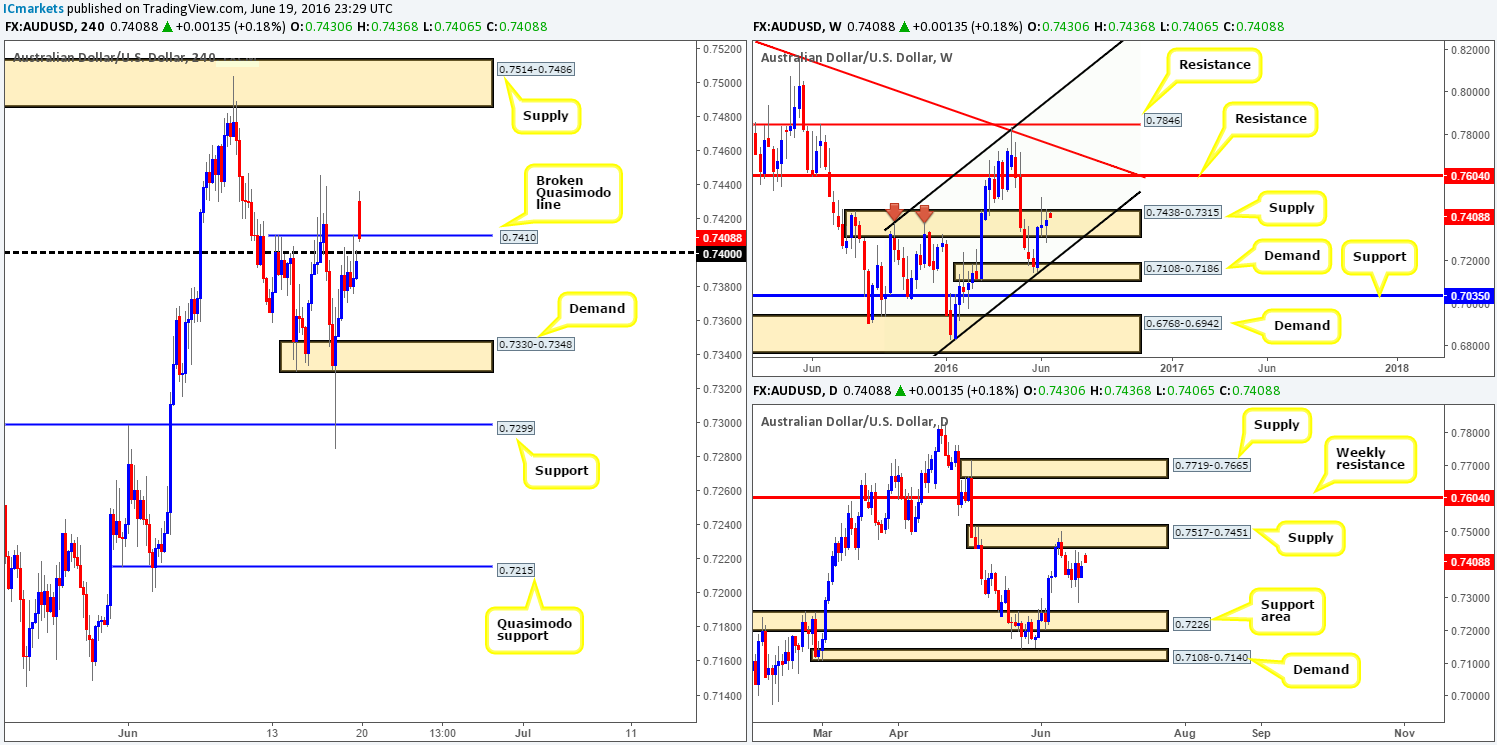
Weekly view: Although the Aussie dollar ranged over 160 pips last week, the pair saw little change going into the close. Weekly supply at 0.7438-0.7315, despite the bulls appearing to have an edge at the moment, remains intact for the time being. A push through this area, however, would likely place weekly resistance at 0.7604 in the firing range. Meanwhile, a bearish stance from here could see the commodity currency touch base with weekly trendline support extended from the low 0.6827.
Daily view: Turning over a page to the daily chart, daily supply at 0.7517-0.7451 is now seen within touching distance. This area could, as it did a few weeks back, be enough to help suppress buying pressure within the aforementioned weekly supply zone.
H4 view: In view of price gapping 35-pips north this morning, and very little noteworthy movement to report during Friday’s trading, what’s likely in store for this market today and possibly going into the week? Well, considering that the weekend gap has essentially been filled now and price is currently trading from a H4 broken Quasimodo line at 0.7410, a bounce from here is possible. However, it is not somewhere we’d stamp high probability since both the weekly and daily charts show buying to be very risky at the moment (see above)
Our suggestions: Personally, we would not be interested in trading this pair until price closes below the 0.74 handle. Reason being is the path beyond this number appears relatively clear down to H4 demand at 0.7330-0.7348 and also trades in-line with both weekly and daily flow (see above). For us to be given the green light beyond 0.74, nevertheless, we’d need to see price retest the number as resistance followed by a lower timeframe sell signal. For ideas on how to find entry techniques, see the top of this report.
Of course, should this move come into view this week, price could potentially stretch much further than the aforementioned H4 demand – one only has to look at the bigger picture to see this!
Levels to watch/live orders:
- Buys: Flat (Stop loss: N/A).
- Sells: Watch for price to consume 0.74 and look to trade any retest seen thereafter (lower timeframe confirmation required).
USD/JPY:
Weekly gain/loss: – 283 pips
Weekly closing price: 104.08
Weekly opening price: 104.70
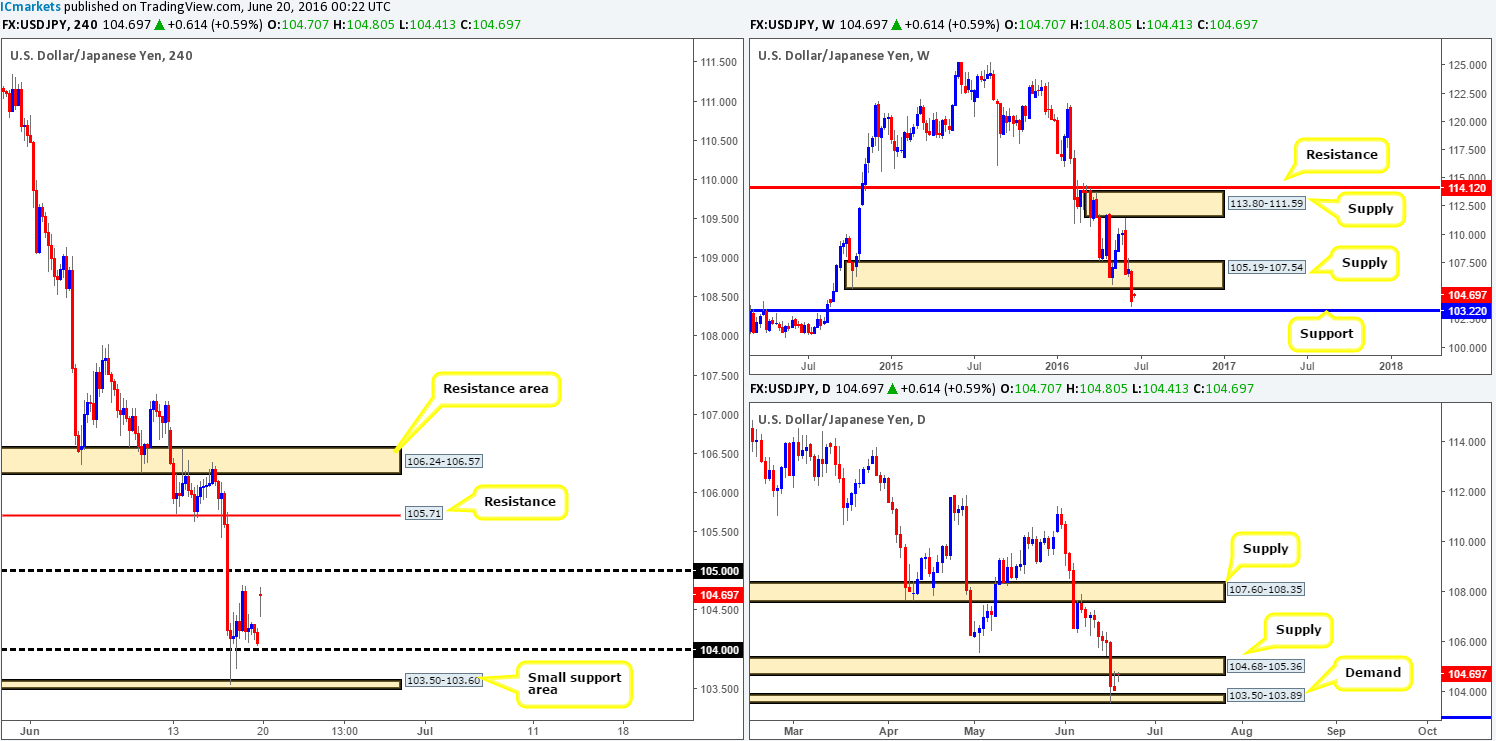
Weekly view: Last week’s sharp run to the downside pushed the USD into further losses against the safe-haven Yen, stripping close to 300 pips off its value. This, as can be seen from the weekly chart, saw this unit take out weekly demand at 105.19-107.54 (now acting supply) and come within touching distance of connecting with weekly support at 103.22. To our way of seeing things, both of the above said areas hold equal weight.
Daily view: Despite the currency finding support from daily demand at 103.50-103.89 on Thursday, daily supply at 104.68-105.36 (located just within the aforementioned weekly supply zone) held price lower on Friday, which is, thanks to this morning’s gap north, where price is trading from currently.
H4 view: After a rather quiet day on Friday, the pair started the week on a relatively volatile note, gapping over sixty-pips north! With this in mind, here are the battle lines we currently have noted down for today and possibly going into the week. However, before these lines are hit, there is a strong possibility that price will sell-off to fill the weekend gap, so do be prepared for this.
- The first line of interest can be seen at the 105 handle. Not only is this line housed within the current daily supply zone at 104.68-105.36, it also sits only nineteen pips below the weekly supply area seen at 105.19-107.54.
- The second barrier we have our eye on comes in at 105.71 – a H4 resistance level. This line is housed within both of the above said higher timeframe zones, and has proved itself as a worthy support in the past!
Our suggestions: Seeing as how the above hurdles are fixed levels, we would strongly advise only trading these lines with a supporting lower timeframe sell signal. This could be in the form of an engulf of demand, a trendline break/retest or simply a collection of well-defined selling wicks around the resistance level.
Levels to watch/live orders:
- Buys: Flat (Stop loss: N/A).
- Sells: 105 region [Tentative – confirmation required] (Stop loss: dependent on where one confirms this area). 105.71 region [Tentative – confirmation required] (Stop loss: dependent on where one confirms this area).
USD/CAD:
Weekly gain/loss: +117 pips
Weekly closing price: 1.2888
Weekly opening price: 1.2842
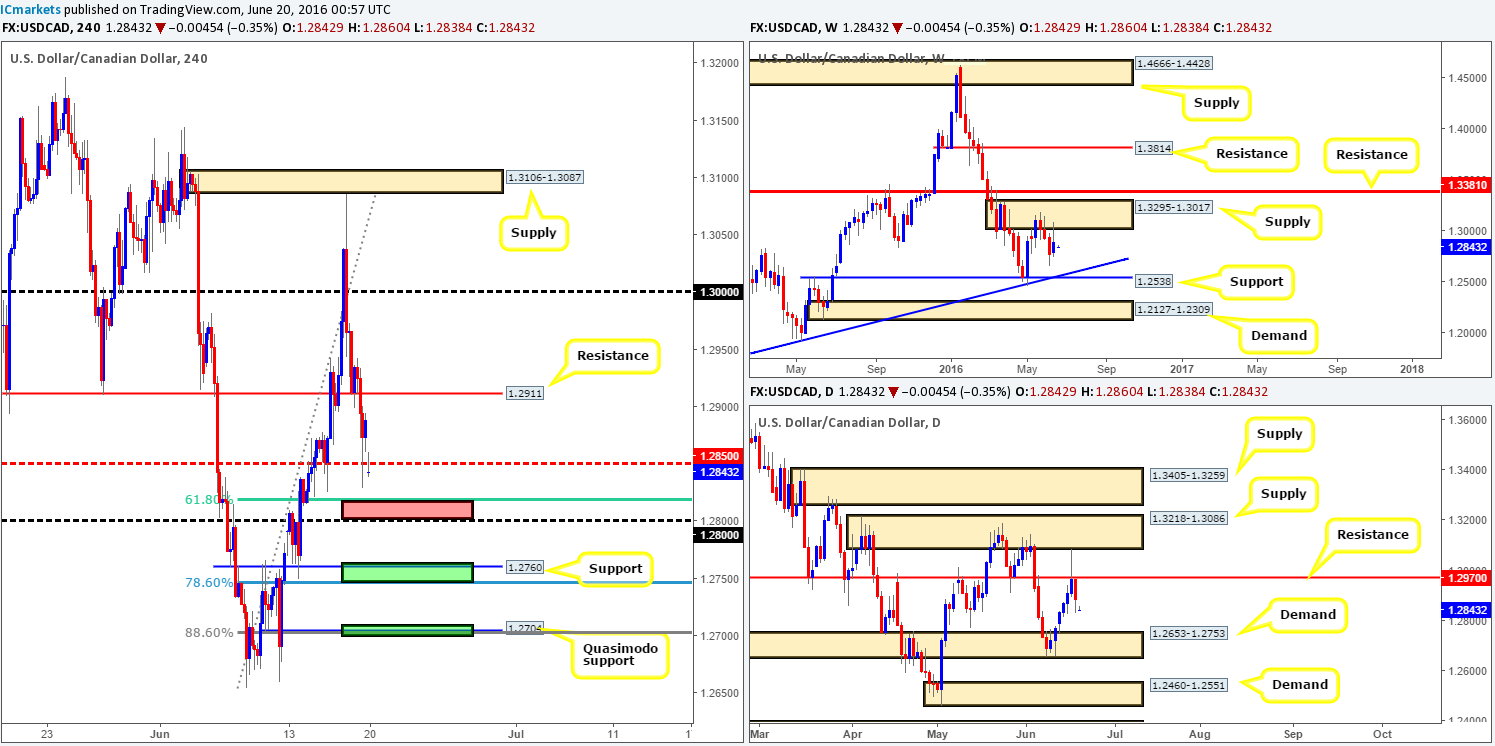
Weekly view: The previous week’s action saw the loonie spike north to reconnect with weekly supply at 1.3295-1.3017, which has so far done a good job in holding the USD lower. From this angle, the next downside target can be seen at a weekly trendline support extended from the high 1.1278.
Daily view: Climbing down to the daily chart, resistance at 1.2970 held price beautifully on Thursday, consequently forcing the pair lower on Friday. The next area of interest from here is seen at the daily demand zone drawn from 1.2653-1.2753 that sits above the aforementioned weekly trendline support.
H4 view: Following Friday’s relatively heavy push to the downside, H4 support at 1.2911 was taken out (now acting resistance). Going into this morning’s open, however, the pair saw a relatively volatile fifty-pip gap south, which, as you can see, took out H4 mid-way support at 1.2850 in the process.
In that 1.2850 is holding as resistance right now, there is a chance of further selling this morning. Nevertheless, H4 structure prevents us from taking a short here. Directly below sits a H4 support area marked in red formed between the 1.28 handle and a H4 61.8% Fib support at 1.2819. And just below this sits two more H4 support zones (H4 78.6% support at 1.2746, H4 support at 1.2760/H4 Quasimodo support at 1.2704, 1.27 handle and a H4 88.6% Fib support at 1.2702), which will very likely bounce price!
Our suggestions: Watch for buy entries (preferably on the lower timeframes – see the top of this report for entry techniques) around the two lower H4 buy green zones (1.2746/1.2760 – 1.27/1.2705). Both of these H4 buy zones are located either within the current daily demand area, or just above it, so there is a good chance of a bounce being seen, despite weekly price showing room to drive lower.
Levels to watch/live orders:
- Buys: 1.2746/1.2760 [Tentative – confirmation required] (Stop loss: dependent on where one confirms this area). 1.27/1.2705 [Tentative – confirmation required] (Stop loss: dependent on where one confirms this area).
- Sells: Flat (Stop loss: N/A).
USD/CHF:
Weekly gain/loss: – 45 pips
Weekly closing price: 0.9594
Weekly opening price: 0.9588
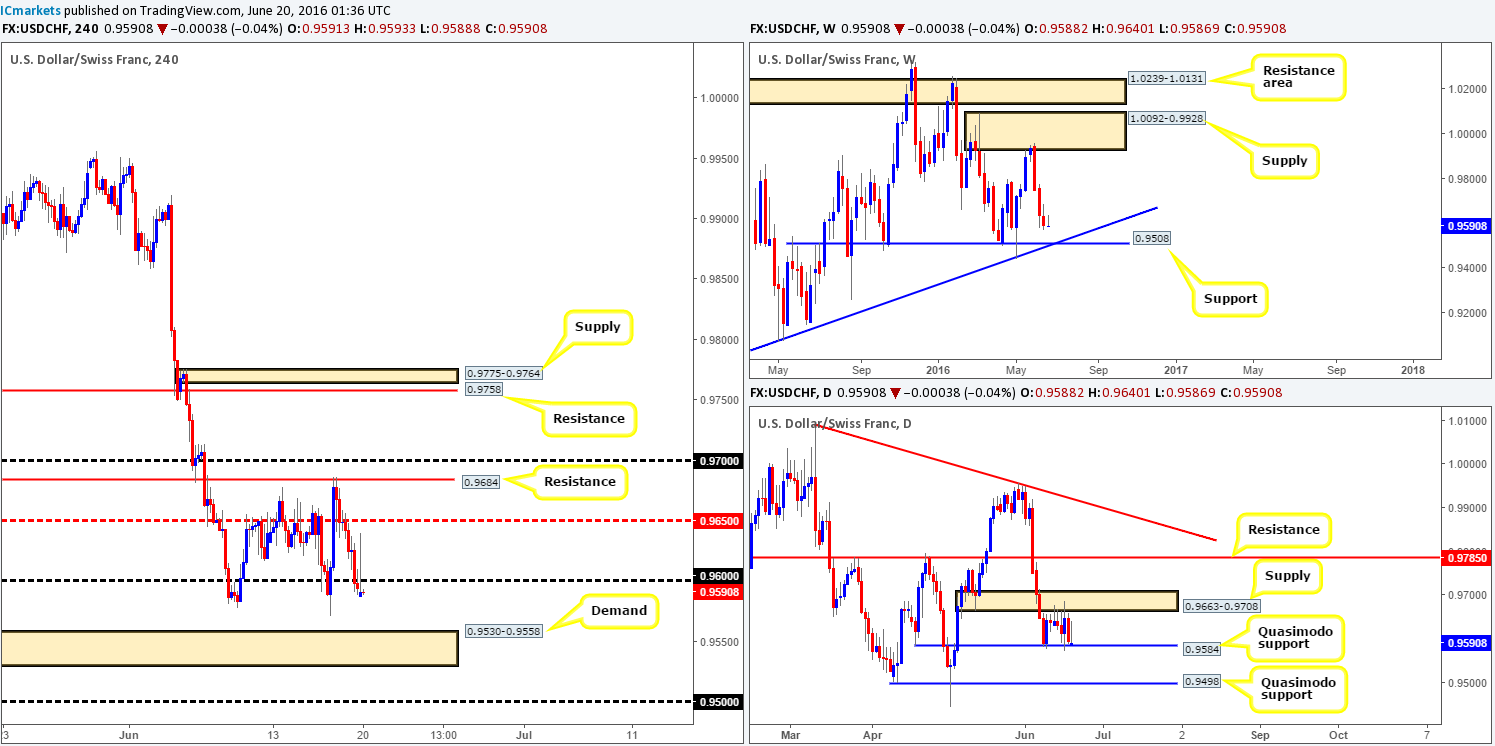
Weekly view: Recent action shows that the USD/CHF extended its decline from supply at 1.0092-0.9928 for the third consecutive week last week, bringing price to lows of 0.9578. Quite frankly, we see very little support in this market to stop the Swissy from continuing to push lower down to weekly support drawn from 0.9508, which coincides nicely with weekly trendline confluence taken from the low 0.9078.
Daily view: Since the 8th June, daily action has been sandwiched between a daily supply zone at 0.9663-0.9708 and a daily Quasimodo support at 0.9584. Any sustained move beyond the current daily supply would likely place daily resistance at 0.9785 in the spotlight. Meanwhile, a push below the daily Quasimodo support potentially opens the floodgates down to 0.9498 – another daily Quasimodo support line.
H4 view: Analyzing Friday’s sessions on the H4 chart shows that the bid-side of this market came under serious pressure during the course of the day. This, as is shown on the chart, saw this unit end the week closing just below the 0.96 handle.
With only a mere six-pip change seen at this morning’s open, price remains below 0.96 despite an earnest attempt from the bulls to drive this market higher! Although looking for shorts from below 0.96 looks appealing due to weekly action also showing room to drive lower (see above), let’s not forget that daily price trades around a daily Quasimodo support at 0.9584.
Our suggestions: Wait for at least a H4 close below the daily Quasimodo support at 0.9584 before looking to trade short, targeting H4 demand at 0.9530-0.9558, followed closely by the 0.95 handle (essentially marking the weekly support mentioned above at 0.9508). How one chooses to trade from here of course is totally down to the individual trader. However, we would recommend not rushing in here since daily bulls may still have some clout from 0.9584!
Levels to watch/live orders:
- Buys: Flat (Stop loss: N/A).
- Sells: Watch for a H4 close below the current daily Quasimodo support at 0.9584 before looking to take shorts in this market.
DOW 30:
Weekly gain/loss: – 221 points
Weekly closing price: 17651
Weekly opening price: 17651
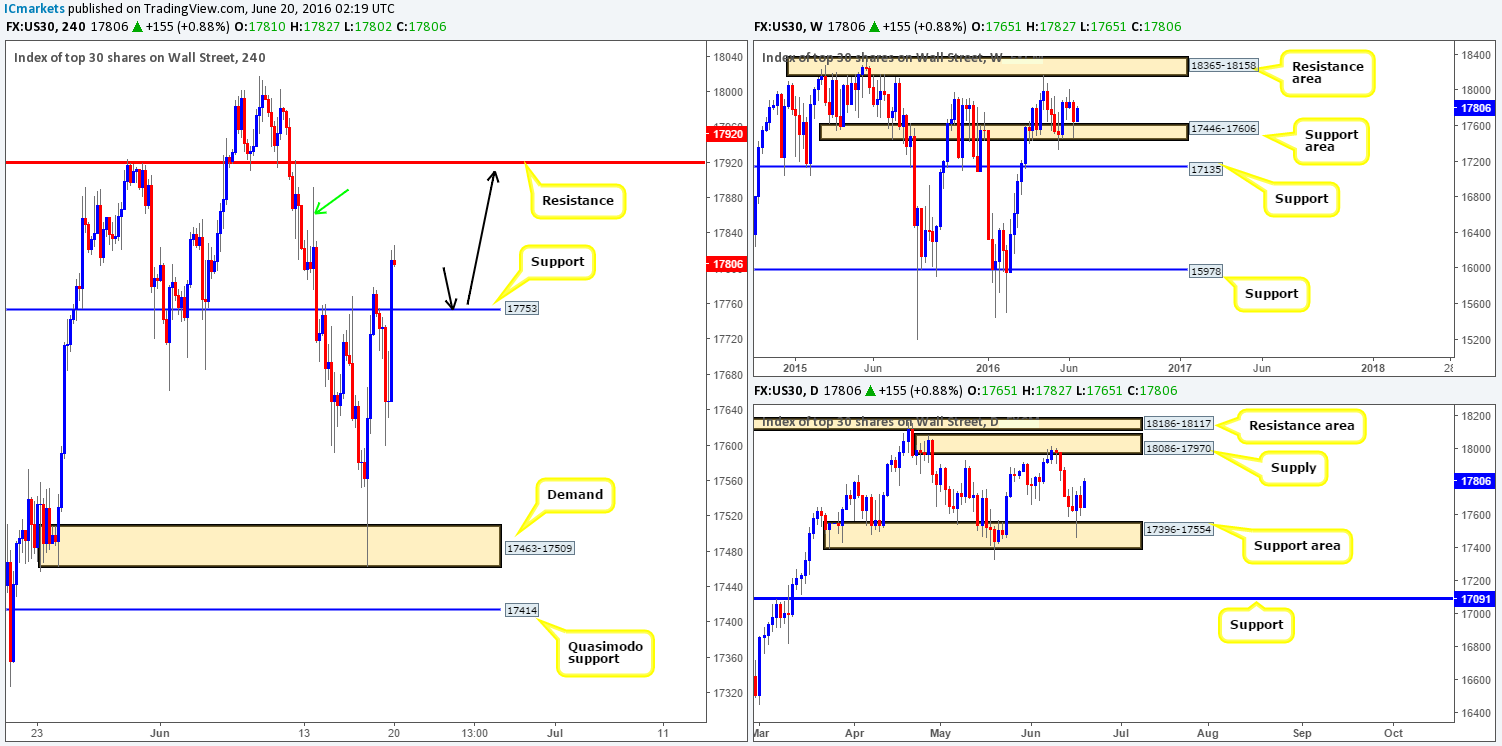
Weekly view: From the weekly viewpoint, US stocks are currently being bolstered by a weekly support area carved from 17446-17606. In light of this, the DOW could potentially rally as far as the weekly resistance area coming in at 18365-18158, which is, as far as we see it, the next upside target.
Daily view: Casting our lines down into the daily chart, we can see that following the bullish response from the daily support area at 17396-17554, bids continue to reinforce this market. In the event that this buying pressure is maintained, there’s little stopping price from plugging into daily supply seen at 18086-17970.
H4 view: Despite price selling-off from H4 resistance at 17753 on Friday, the bulls quickly reversed these losses going into this morning’s opening trade. H4 resistance is, thanks to this recent buying, now considered to be H4 support. Since we know that both the weekly and daily charts show room to extend higher (the closest resistance can be seen at the aforementioned daily supply), buying seems a good option right now.
Our suggestions: Put simply, our team is currently watching for buy trades on any retest seen at H4 support taken from 17753 (see black arrows). Similar to the higher timeframes, H4 shows little resistance on the horizon until 17920. The wick seen marked with a green arrow does not, at least to us it doesn’t, resemble supply. What it does appear to be is a H4 consumption wick, essentially a wick that has consumed supply to allow price to advance.
Therefore, do keep an eyeball on 17753 today and try to refrain from entering here at market since a fakeout is highly likely. Waiting for lower timeframe confirmation at this number is key to a successful trade in our opinion (for ideas on lower timeframe entry techniques see the top of this report) as there is little worse than getting your stop hit only then to see price go on to hit your take-profit target!
Levels to watch/live orders:
- Buys: 17753 region [Tentative – confirmation required] (Stop loss: dependent on where one confirms this area).
- Sells: Flat (Stop loss: N/A).
GOLD:
Weekly gain/loss: + $23.8
Weekly closing price: 1297.5
Weekly opening price: 1297.5
Weekly view: The gold market enjoyed another successful rally north last week, gaining close to $24 in value! In consequence, the yellow metal spiked above a weekly supply zone drawn from 1307.4-1280.0 and has begun to reverse tracks. This area has been visited twice already and each time responded with relatively aggressive selling.
Daily view: From this angle, however, the metal is seen trading from daily demand coming in at 1288.5-1272.9. Assuming that this area holds up against the current weekly supply, we see very little fresh supply to the left of current price until the market reaches 1333.4 – a daily Quasimodo resistance which sits just above a weekly Quasimodo resistance at 1331.0 (the next upside target beyond the current daily supply).
H4 view: Despite an earnest attempt from the buyers on Friday, price is, thanks to aggressive selling seen this morning, now trading back at H4 demand at 1282.1-1278.5. Provided that the buyers hold ground here, there’s upside potential seen to at least H4 resistance drawn from 1303.1, followed closely by H4 resistance at 1315.4 on this timeframe.
Technically, this market is a bit of a tricky beast to trade today. On the one hand there is potential for a sell-off from the weekly supply base at 1307.4-1280.0, and on the other hand, both H4 and daily buyers are trading from demand (see above).
Our suggestions: Ultimately our team ALWAYS tries to trade in their own best interests. And by doing so we usually avoid setups that are positioned nearby higher timeframe areas unless the lower timeframe price action is extremely convincing! Therefore, the best, and in our opinion, most logical route to take today would be to wait and see if price closes below the current H4 demand area. This, at least in our opinion, would indicate weakness within the current daily demand and strength from the current weekly supply, and to top it off, open up the path south down to H4 demand at 1264.4-1266.5 (sits just above daily support at 1262.2 – the next downside target beyond the current daily demand).
To trade this setup, nevertheless, we’d need to see two things happen. Firstly, a retest to the underside of the broken H4 demand would need to be seen, and secondly a lower timeframe sell signal following the retest (see the top of this report for entry techniques). Now, of course, how one enters here depends totally on the individual trader as some are aggressive and could simply short the breakout below the H4 demand, and others, like us, are conservative who needs a little more confirmation to be confident in risking risk capital.
Levels to watch/live orders:
- Buys: Flat (Stop loss: N/A).
- Sells: Watch for price to consume 1282.1-1278.5 and look to trade any retest seen thereafter (lower timeframe confirmation required).
