Waiting for lower timeframe confirmation is our main tool to confirm strength within higher timeframe zones, and has really been the key to our trading success. It takes a little time to understand the subtle nuances, however, as each trade is never the same, but once you master the rhythm so to speak, you will be saved from countless unnecessary losing trades. The following is a list of what we look for:
- A break/retest of supply or demand dependent on which way you’re trading.
- A trendline break/retest.
- Buying/selling tails/wicks – essentially we look for a cluster of very obvious spikes off of lower timeframe support and resistance levels within the higher timeframe zone.
We typically search for lower-timeframe confirmation between the M15 and H1 timeframes, since most of our higher-timeframe areas begin with the H4. Stops are usually placed 1-3 pips beyond confirming structures.
EUR/USD:
Weekly gain/loss: +1.08%
Weekly closing price: 1.1787
Over the course of last week’s trading, the single currency extended its bounce from weekly support at 1.1616. This, as you can see, lifted weekly price up to a supply base coming in at 1.1880-1.1777, which has so far held ground. A violation of this area, however, would likely bring the weekly resistance level seen at 1.2044 into the spotlight. Don’t underestimate this barrier, as it has a solid history behind it!
Moving ourselves down to the daily timeframe, we can see that price came within touching distance of a resistance level plotted at 1.1878 on Wednesday and managed to chalk up a nice-looking selling wick. Be that as it may, this move was (and still is) somewhat marred by the fact that there is a nearby cloned trendline support taken from the high 1.2092.
A quick recap of Friday’s action on the H4 timeframe shows that the unit peaked at a high of 1.1821 during the early hours of trading. Following this, price cracked through bids at 1.18 and challenged October’s opening level at 1.1788, which held firm despite multiple attempts to break lower. As 1.18 also proved a worthy resistance, the euro ended the week revisiting October’s opening level.
Suggestions: Looking for longs above 1.18 would, in our technical view, be considered a risky play given the fact that this would entail buying into a weekly supply. Along similar lines, a violation of October’s opening level is also problematic for sellers. Besides having to contend with the nearby H4 trendline support extended from the high 1.1875, the candles would also be clashing with the aforementioned daily trendline supports!
All things considered, this is a relatively restricted market at the moment. For that reason, opting to stand on the sidelines may very well be the best path to take today.
Data points to consider: ECB President Draghi speaks at 2/4pm GMT.
Levels to watch/live orders:
- Buys: Flat (stop loss: N/A).
- Sells: Flat (stop loss: N/A).
GBP/USD:
Weekly gain/loss: +0.17%
Weekly closing price: 1.3214
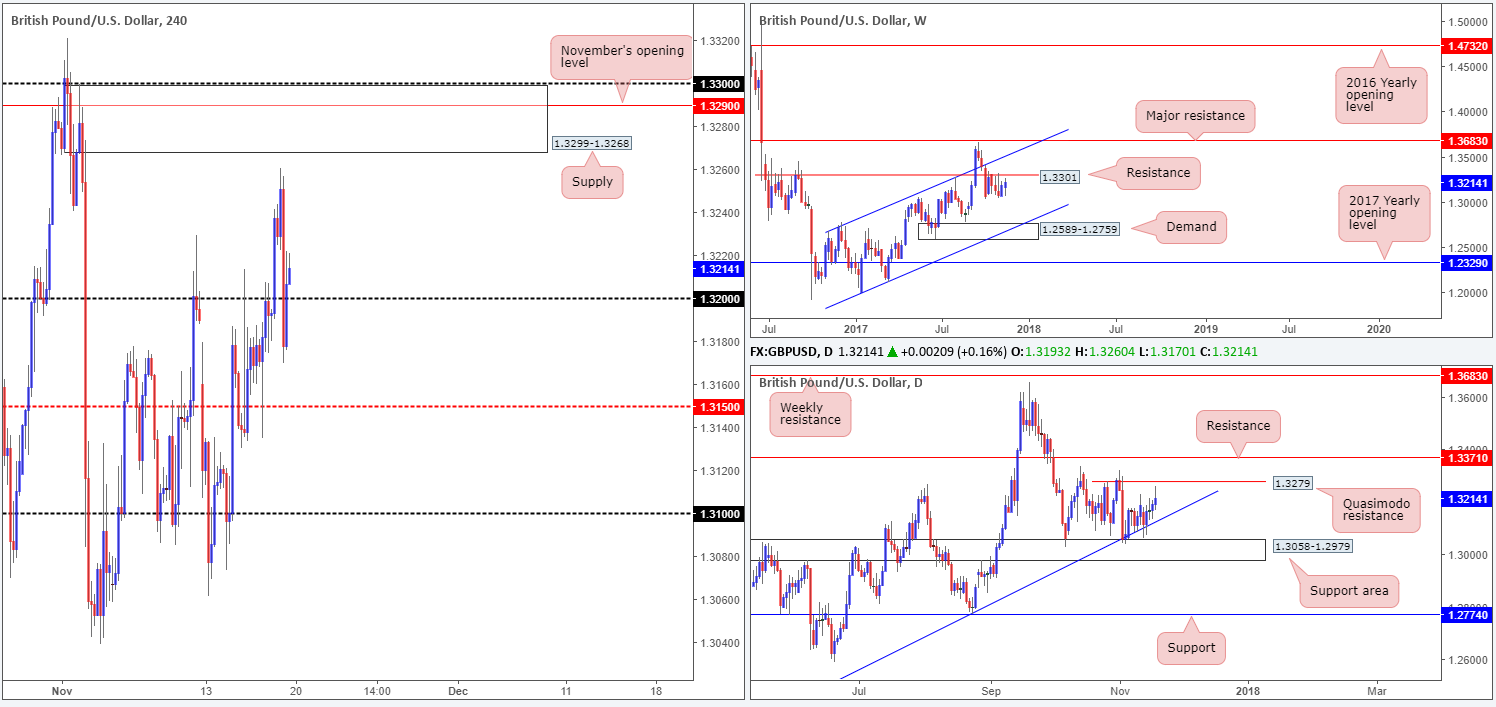
Since early October, the GBP/USD has been consolidating beneath a weekly resistance level coming in at 1.3301. Should a breakout to the upside occur, it seems price would be all set to extend up to a weekly channel resistance taken from the high 1.2673. On the other side of the coin, a move to the downside would likely bring the candles down to a weekly demand seen at 1.2589-1.2759 that fuses with a weekly channel support etched from the low 1.1986.
Turning our attention over to the daily candles, it’s clear that downside remains capped by a daily trendline support drawn from the low 1.2108. Also notable is the fact that daily price recently popped higher and came within 20 pips of connecting with a Quasimodo resistance at 1.3279, which happens to be positioned only 20 or so pips beneath weekly resistance mentioned above at 1.3301.
A brief look at recent dealings on the H4 timeframe shows us that price topped just ahead of a supply barrier seen at 1.3299-1.3268 going into the London open on Friday. From that point, the British pound violently whipsawed through the 1.32 handle, tapping a session low of 1.3170, and wrapping up the day closing 14 pips above 1.32.
Suggestions: The H4 supply mentioned above at 1.3299-1.3268 is a heavy-weight area, in our view. Besides housing November’s opening level at 1.3290 and placed nearby the 1.33 band (which essentially represents the aforementioned weekly resistance level), it also encapsulates the noted daily Quasimodo resistance. As a result, buying in and around this area is strictly out of the question for us. A sell on the other hand is interesting. We particularly like November’s opening level as an entry point, with stops planted just above the daily Quasimodo resistance apex (1.3321) at 1.3324.
Data points to consider: ECB President Draghi speaks at 2/4pm GMT.
Levels to watch/live orders:
- Buys: Flat (stop loss: N/A).
- Sells: 1.3290 (stop loss: 1.3324).
AUD/USD:
Weekly gain/loss: -1.28%
Weekly closing price: 0.7563
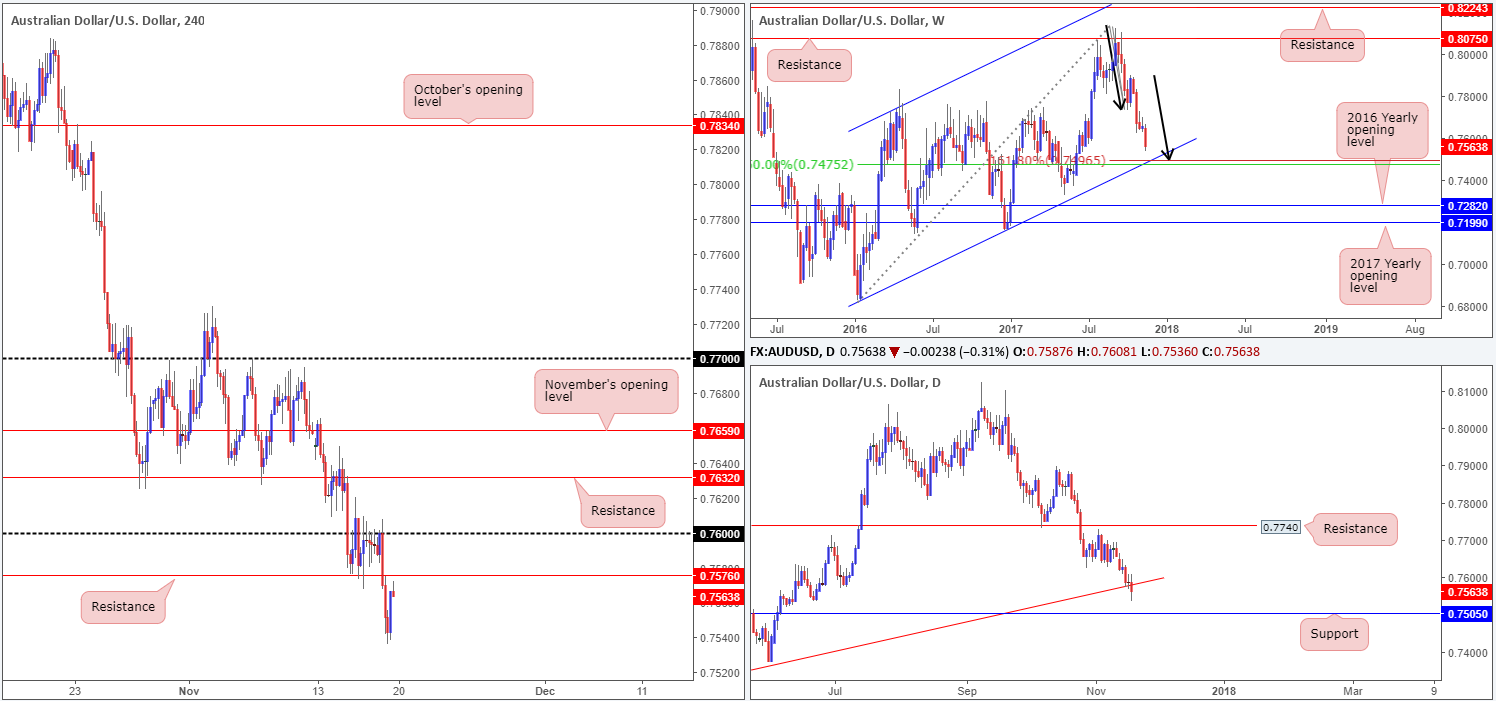
The commodity currency boarded the pain train last week, dropping almost 100 pips. What this recent downside move did accomplish, however, was bring weekly price down to within shouting distance of a particularly interesting level. Merging with a weekly channel support extended from the low 0.6827, we have a nice-looking weekly AB=CD (see black arrows) 161.8% Fib ext. point at 0.7496 that also aligns with a 50.0% value at 0.7475 taken from the high 0.8125.
In conjunction with weekly price, Friday’s daily candle ripped its way through a daily trendline support taken from the low 0.7159. With daily structure showing little active demand to the left of current price, this could suggest that we may see a move down to daily support found at 0.7505 sometime this week.
Over on the H4 timeframe, support at 0.7576 was taken out during the early hours of Friday. Further losses were seen until the unit struck a session low of 0.7536 going into the US open. Price managed to trim losses from this point and bring the Aussie back up to just ahead of the recently broken support-turned resistance at 0.7576.
Suggestions: After looking through each timeframe, here’s what we have noted so far:
- Selling from the H4 resistance at 0.7576 could be an option, targeting the 0.75 handle. Waiting for H4 price to print a full or near-full-bodied bearish candle is advised here since the unit could just as easily be drawn to the 0.76 handle.
- Buying from the 0.75 region is a high-probability setup, in our opinion. Not only is there a weekly channel support intersecting with this line, there’s also a weekly AB=CD 161.8% ext. point at 0.7496 and a daily support at 0.7505. To give the trade room to breathe, we would look to place stops 45-50 pips below 0.75.
Data points to consider: No high-impacting news events on the docket.
Levels to watch/live orders:
- Buys: 0.75 (stop loss: 0.7455).
- Sells: 0.7576 region ([waiting for a reasonably sized H4 bearish candle to form – preferably a full or near-full-bodied candle – is advised] stop loss: ideally beyond the candle’s wick).
USD/JPY:
Weekly gain/loss: -1.27%
Weekly closing price: 112.08
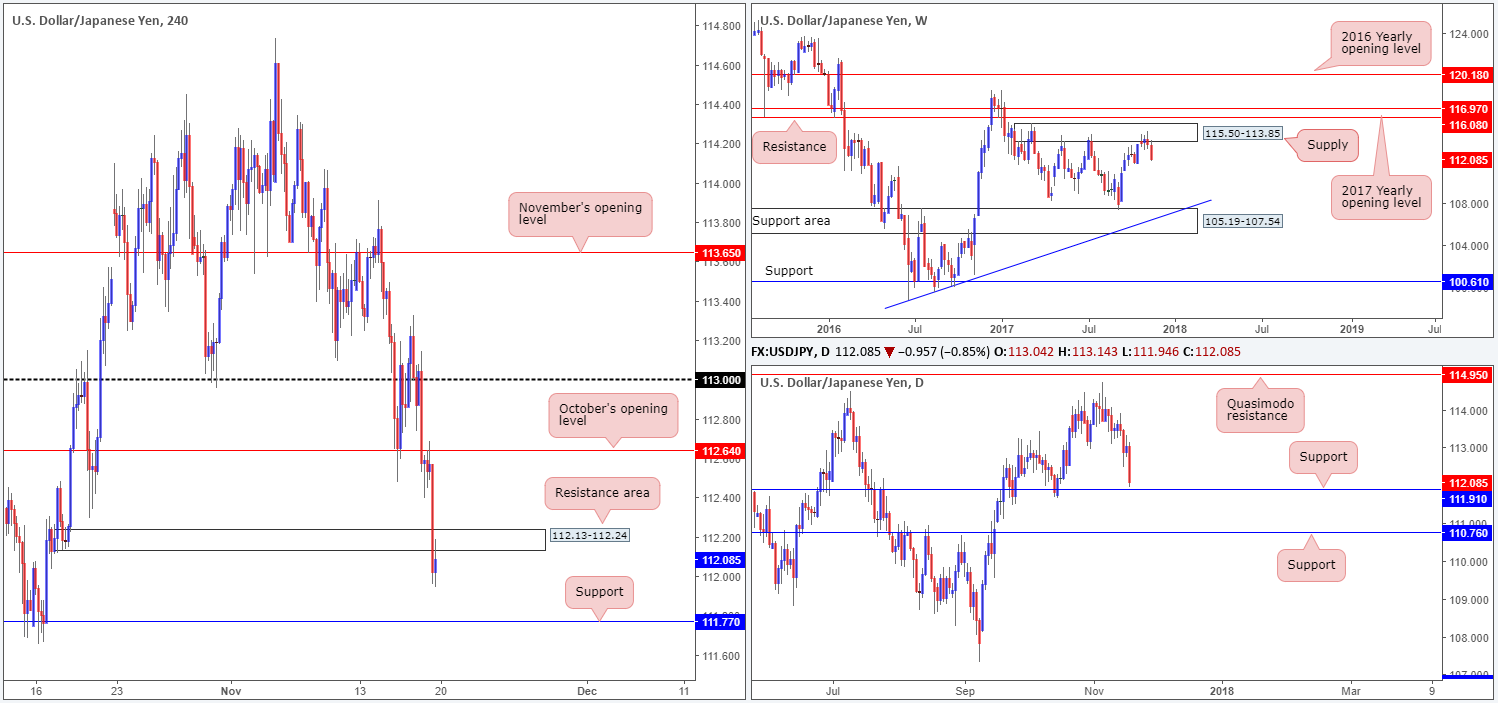
After three weeks of consolidation around the underside of a weekly supply zone at 115.50-113.85, weekly price finally moved out of first gear! Dropping approximately 140 pips last week, the weekly candle printed a near-full-bodied bearish formation. As you can probably see from the weekly timeframe, there is also room for further downside down to as far as the support area at 105.19-107.54, which aligns with a trendline support taken from the low 98.78.
Skimming over to the daily timeframe, however, the candle action wrapped up the week closing just ahead of a reasonably distinguished support at 111.91. Because of this, traders have to be prepared for the possibility that the bulls may try and pare recent losses from here this week.
As is clearly seen on the H4 timeframe, Friday’s downside move gained speed after a retest to the underside of October’s opening level at 112.64. In one fell swoop, the H4 demand area at 112.13-112.24 was consumed, and shortly after retested as a resistance area going into the closing bell. Assuming that the bears remain in the driving seat, the next downside target on the H4 scale can be seen at 111.77: a support level that is positioned only a few pips beneath the noted daily support.
Suggestions: Neither a long nor short seems appropriate right now. Initiating a short trade on the basis of the selloff from weekly supply would place one in a difficult position on the daily timeframe. Likewise, a long from the daily support, or even the H4 support seen just below it, would position one against potential weekly selling.
As a result, our desk will likely remain on the sidelines and look to reassess structure going into Tuesday’s opening bell.
Data points to consider: No high-impacting news events on the docket.
Levels to watch/live orders:
- Buys: Flat (stop loss: N/A).
- Sells: Flat (stop loss: N/A).
USD/CAD:
Weekly gain/loss: +0.02%
Weekly closing price: 1.2769
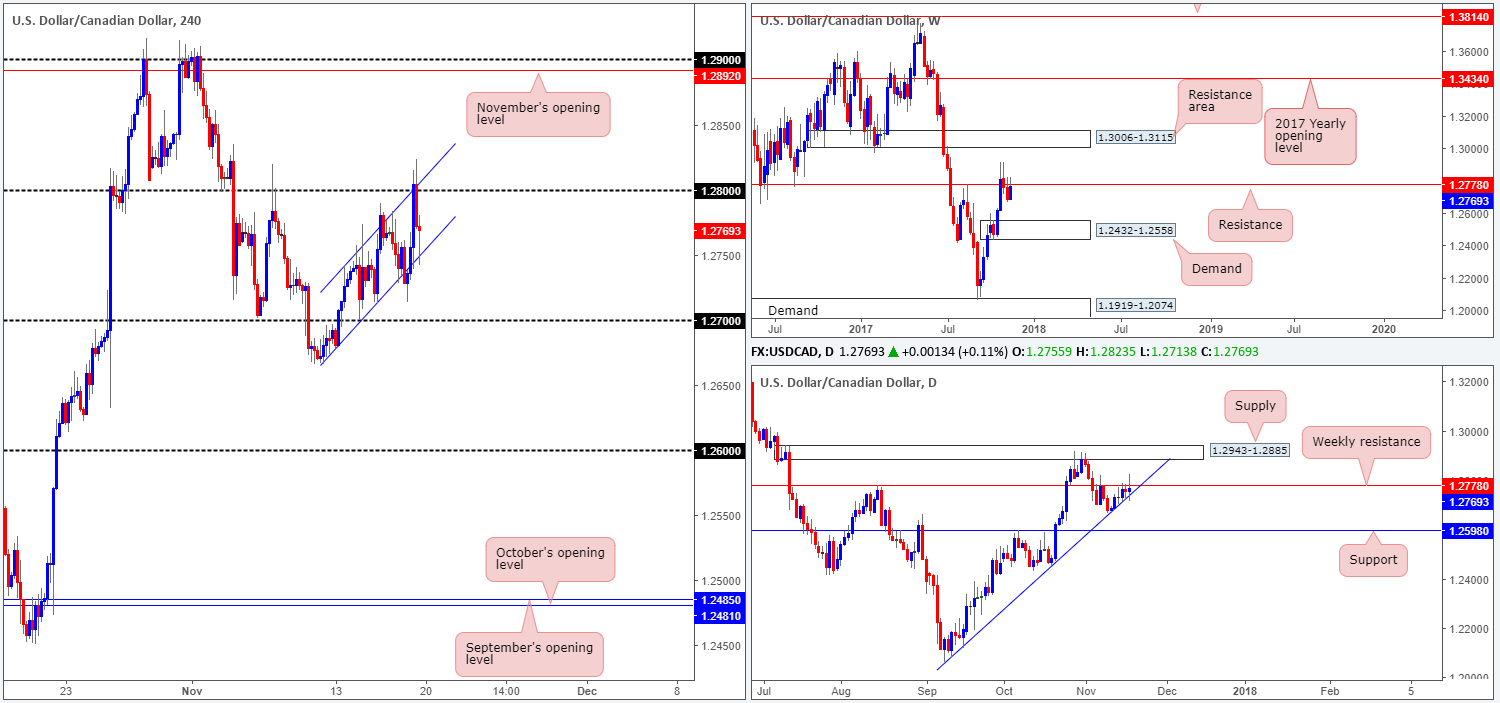
USD/CAD prices are effectively unchanged this week. Weekly price, as you can see, reversed the prior week’s losses and retested weekly resistance at 1.2778. This level shares a strong history that dates back to early 2004, so it is not one to ignore! In the event that the market dips south from this barrier again, traders’ crosshairs will likely be fixed on the weekly demand at 1.2432-1.2558. Boasting a strong base, this demand area communicates strength and, therefore, will likely hold back sellers should the area come into play.
A closer look at the action on the daily timeframe shows that although the weekly candles look poised to stamp lower, daily price is tightly confined between the said weekly resistance and a daily ascending trendline carved from the low 1.2061.
Moving across to the H4 timeframe, the candles have been compressed within an ascending H4 channel (1.2666/1.2741) for the best part of last week. What’s also notable is the pair failed to sustain gains beyond the 1.28 handle on Friday, despite better-than-expected US housing figures and Canadian inflation numbers failing to surprise the markets.
Suggestions: The ideal scenario, as far as we can see, would be for H4 price to print a close below the ascending channel formation and daily trendline support. In our book, this is enough to warrant a short, targeting the 1.27 handle, and maybe even eventually the 1.26 handle, seeing as it aligns beautifully with daily support at 1.2598.
Data points to consider: No high-impacting news events on the docket.
Levels to watch/live orders:
- Buys: Flat (stop loss: N/A).
- Sells: Watch for H4 price to engulf the current H4 channel support/daily trendline support for potential shorting opportunities.
USD/CHF:
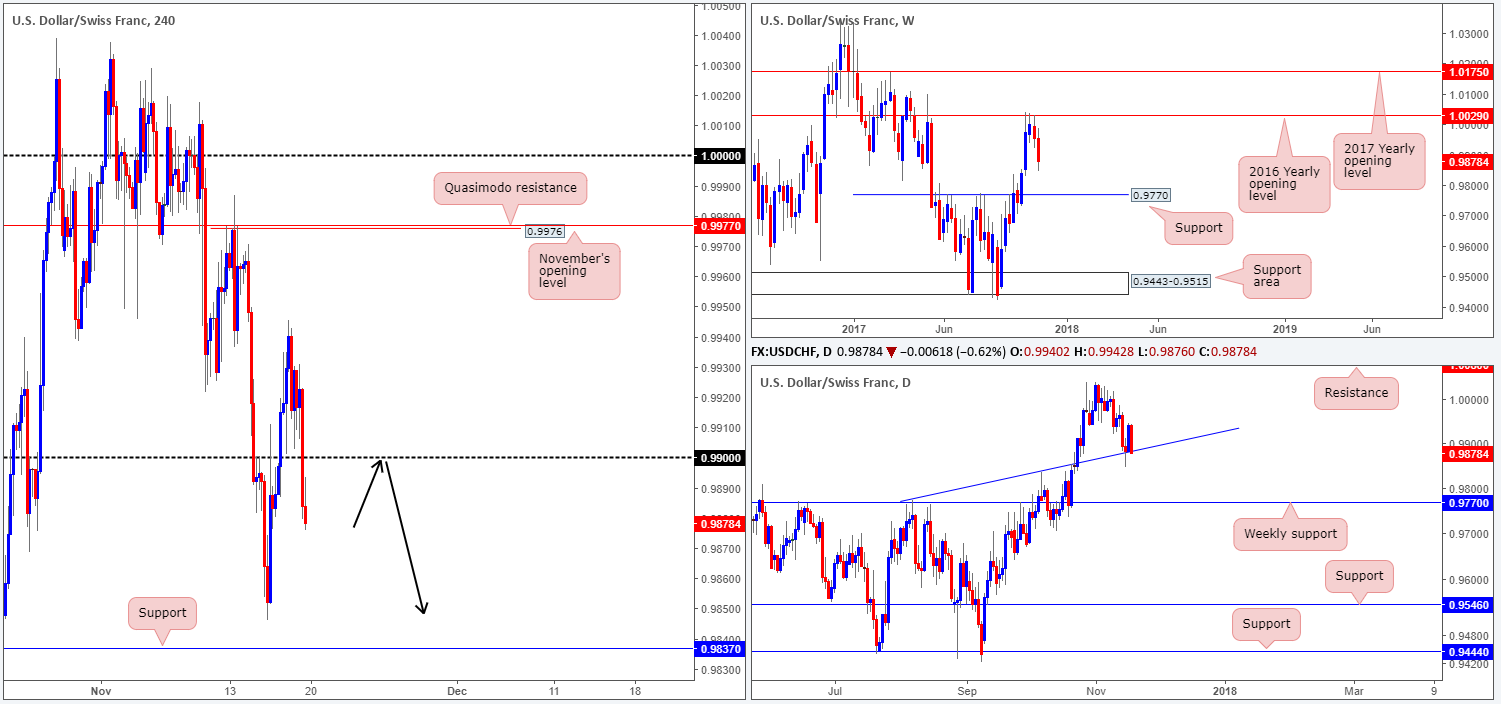
Weekly gain/loss: -0.68%
Weekly closing price: 0.9878
Recent action shows that the USD/CHF extended losses last week, forming a reasonably strong weekly bearish candle. This is likely to encourage further selling this week, especially since there is little weekly structure on the radar until we reach support at 0.9770.
Bouncing down to the daily timeframe, the candles found active buyers around a trendline support taken from the high 0.9773 on Wednesday. Thursday saw price print a nice follow-through bull candle only to be aggressively reversed on Friday. Friday’s candle was, in our technical view, a strong full-bodied formation, and as such, could lead to price driving lower this week and testing the aforementioned weekly support.
Friday’s move lower, as you can see on the H4 timeframe, cracked through the 0.99 handle and has likely opened downside to Wednesday’s low 0.9846, shadowed closely by H4 support pegged at 0.9837.
Suggestions: Taking into account that all three timeframe display bearish intent to some degree, a sell from the underside of 0.99 could be an option. Assuming this comes to fruition, we would only consider a retest of this number valid if, and only if, a H4 full or near-full-bodied candle took shape, since psychological numbers are prone to fakeouts. The first take-profit target would be set at the 0.9850 region, followed closely by 0.9837 and then the 0.98 handle. By that point we would be nearing weekly support, so it might be best to be fully closed out by then.
Data points to consider: No high-impacting news events on the docket.
Levels to watch/live orders:
- Buys: Flat (stop loss: N/A).
- Sells: 0.99 region ([waiting for a reasonably sized H4 bearish candle to form – preferably a full or near-full-bodied candle – is advised] stop loss: ideally beyond the candle’s wick).
DOW 30:
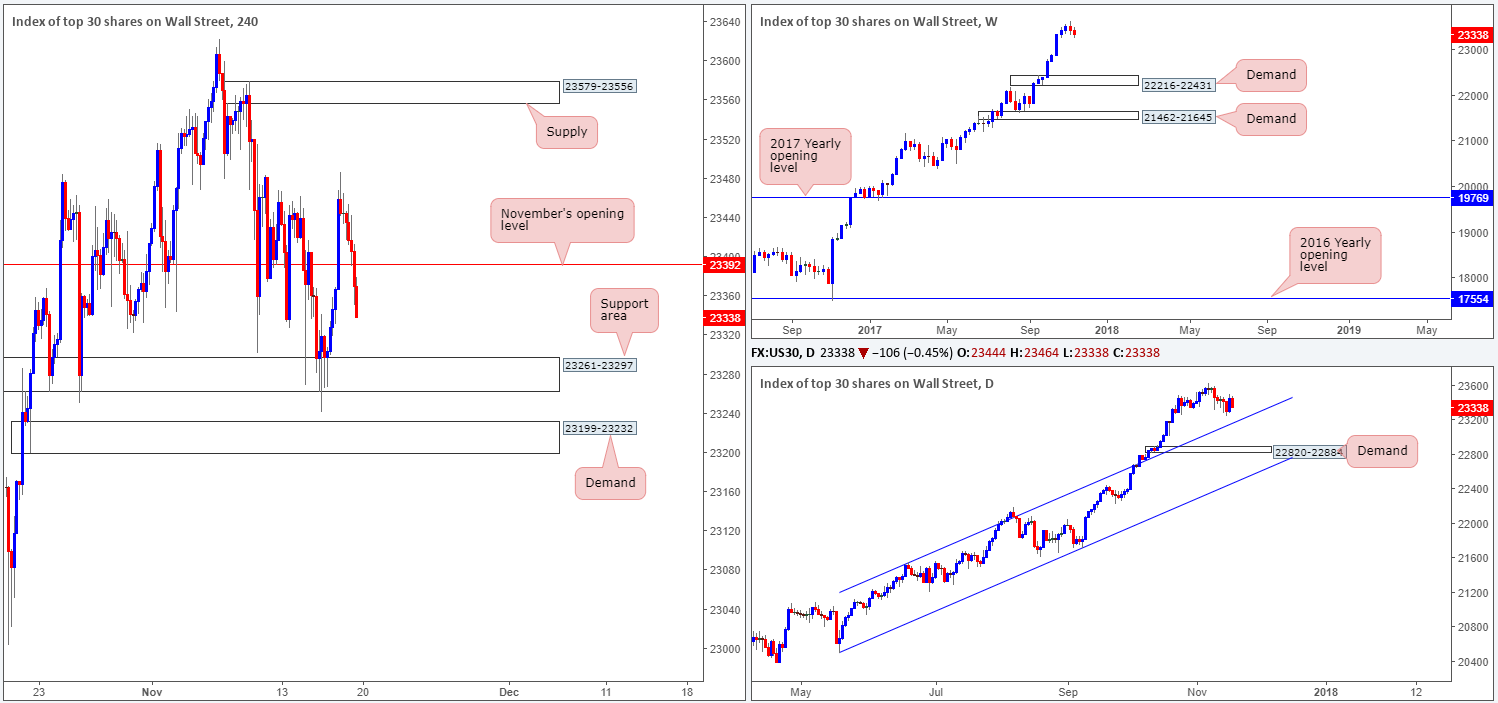
Weekly gain/loss: -0.33%
Weekly closing price: 23338
US equities chalked up a second consecutive losing week in recent trading. This followed the prior week’s weekly bearish engulfing candle after a strong eight-week run north. Having seen that the next downside target on the weekly timeframe does not come into view until 22216-22431, should we expect further selling this week?
Before weekly sellers can push this unit down as far as weekly demand, they’ll have to contend with potential support coming in from a daily trendline support etched from the high 21541, and a daily demand area pegged at 22820-22884.
Equity indexes in the US began the day under pressure on Friday as investors speculate the fate of the tax bill. Snapping below November’s opening level at 23392 on the H4 timeframe, a barrier we were initially interested in buying from, downside is now open to the H4 support area at 23261-23297, followed closely by H4 demand pinned at 23199-23232 (sits on top of the noted daily trendline support).
Suggestions: We do not really like the look of the current H4 support area given the deep H4 tail at 23241 printed through the lower edge on Wednesday. The H4 demand seen below it at 23199-23232, however, may offer the market support, but it may be limited considering that the support area above would likely act as a resistance area.
For now, the team does not see anything worthy of trading and therefore will be remaining on the bench during today’s segment.
Data points to consider: No high-impacting news events on the docket.
Levels to watch/live orders:
- Buys: Flat (stop loss: N/A).
- Sells: Flat (stop loss: N/A).
GOLD:
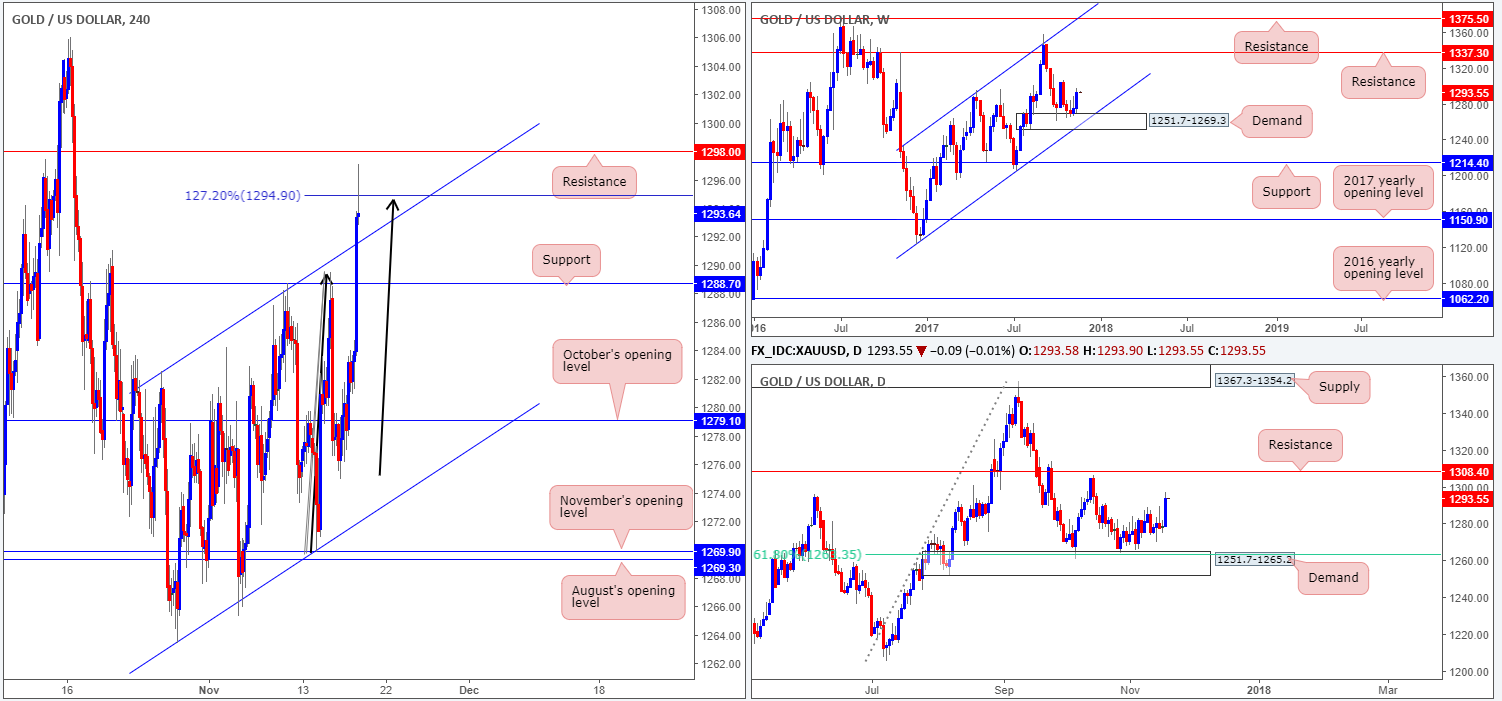
Weekly gain/loss: +1.45%
Weekly closing price: 1293.6
Following three weeks of consolidation around the top edge of a weekly demand area at 1251.7-1269.3, the bulls went on the offensive last week. Provided that the buyers can uphold this momentum, we do not see a whole lot stopping price from rallying as far north as the weekly resistance level at 1337.3.
Branching down to the daily timeframe, however, the next upside target is seen a little nearer: a resistance level located at 1308.4. This barrier boasts a reasonably strong history, so it should certainly not be overlooked. Nevertheless, should weekly buyers engulf this daily level, there is not a lot seen between here and a daily supply zone printed at 1367.3-1354.2 (positioned above the aforementioned weekly resistance level).
With both the weekly and daily timeframes showing room for further buying, the H4 AB=CD 127.2% ext. at 1294.9 may fail to hold ground, despite the H4 bearish selling wick printed at the close. In addition to this, there is the recently engulfed H4 channel resistance-turned support taken from the high 1282.5 to contend with.
Suggestions: While we absolutely love the shape of the current H4 AB=CD bearish pattern, selling based on this is just too risky, given where price stands on the bigger picture at the moment. Therefore, unless we witness a decisive push above H4 resistance at 1298.0, we will be forced to remain flat for the time being.
Levels to watch/live orders:
- Buys: Flat (stop loss: N/A).
- Sells: Flat (stop loss: N/A).

