A note on lower timeframe confirming price action…
Waiting for lower timeframe confirmation is our main tool to confirm strength within higher timeframe zones, and has really been the key to our trading success. It takes a little time to understand the subtle nuances, however, as each trade is never the same, but once you master the rhythm so to speak, you will be saved from countless unnecessary losing trades. The following is a list of what we look for:
- A break/retest of supply or demand dependent on which way you’re trading.
- A trendline break/retest.
- Buying/selling tails/wicks – essentially we look for a cluster of very obvious spikes off of lower timeframe support and resistance levels within the higher timeframe zone.
- Candlestick patterns. We tend to only stick with pin bars and engulfing bars as these have proven to be the most effective.
We search for lower timeframe confirmation between the M15 the H1 timeframes, since most of our higher-timeframe areas begin with the H4. Stops are usually placed 5-10 pips beyond confirming structures.
EUR/USD:
Weekly gain/loss: – 191 pips
Weekly closing price: 1.1082
Weekly opening price: 1.1010
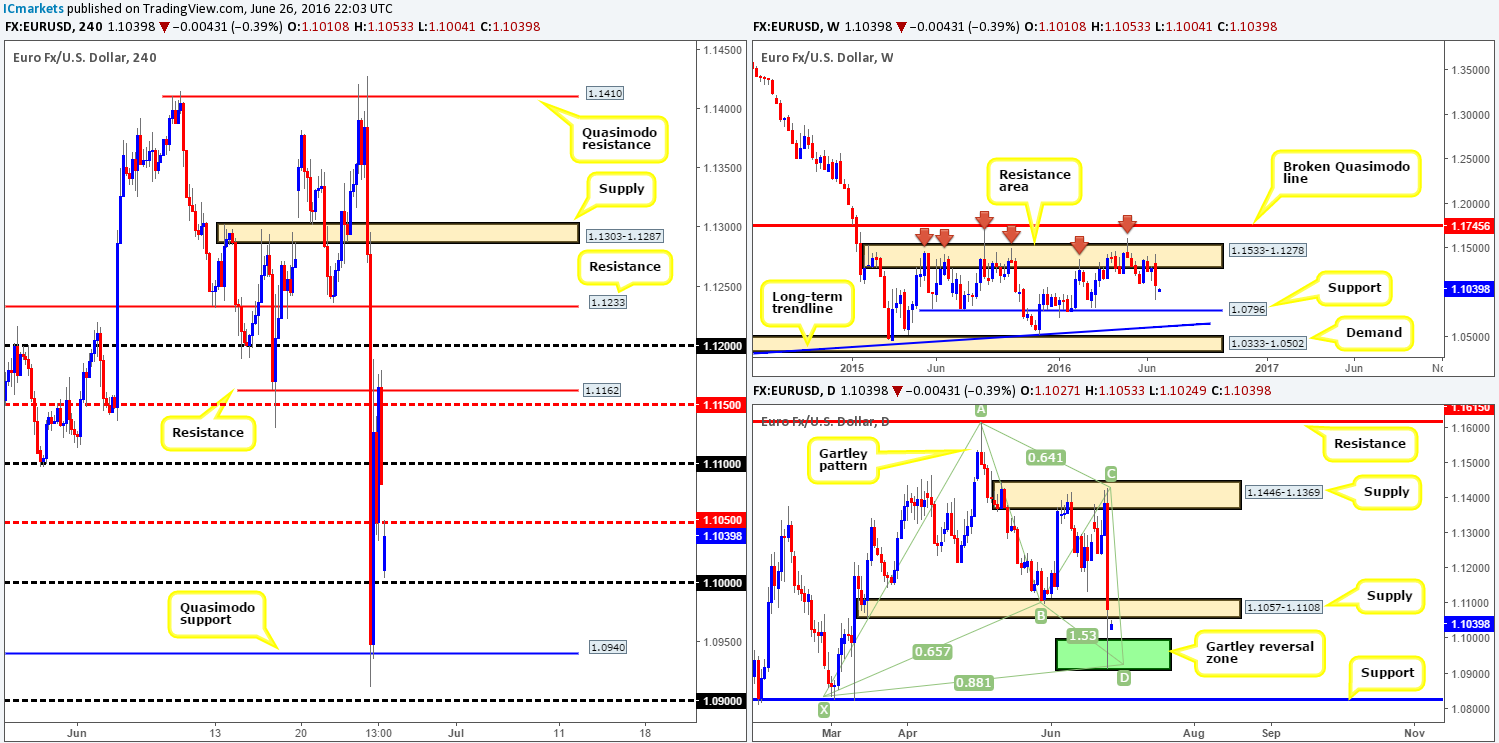
Weekly view: The weekly resistance area at 1.1533-1.1278, once again, played a big part in last week’s trading. Taking into consideration that this zone has primarily capped upside since May 2015 (see red arrows), we feel that price will eventually touch base with weekly support penciled in at 1.0796 in the near future.
Daily view: As can be seen from this chart, ‘Brexit’ forced the shared currency over 500 pips lower from a peak of 1.1427 down to lows of 1.0911. Nevertheless, the pair managed to trim some of the losses from deep within the confines of a Daily Harmonic Gartley reversal zone (1.0910/1.0994 – green zone) back up to 1.1082 by the week’s end. With price currently trading between the aforementioned Gartley reversal zone and a near-term daily supply area at 1.1057-1.1108, direction on this timeframe is somewhat limited until one of these zones is consumed.
H4 view: Despite Friday’s aggressive selling, the EUR, as we mentioned above, managed to recover some of its losses from 1.0911. As is shown on the H4 chart though, going into both the London and US sessions, price found a pocket of resistance around the 1.1162 region, forcing the candles below the 1.11 handle into the week’s close.
Our suggestions: ‘Post Brexit’ trading will likely see an increase in volatility as political uncertainty continues to plague markets in the weeks ahead. Given this, battle lines going into today’s sessions and quite possibly the week are as follows:
- Although the weekly chart shows price trading from a weekly resistance area at 1.1533-1.1278, we still really like the look of the H4 Quasimodo support line at 1.0940. Not only is this number positioned within the daily Gartley reversal zone at 1.0910/1.0994, it was also here where price began to reverse following the ‘Brexit’ shock, which in our opinion, equals very strong support!
- ·The H4 resistance 1.1162 is also a line we’ll be keeping an eye on today/this week simply due to the fact that this is where price also managed to bounce during ‘Brexit’.
Given the likelihood of increased volatility, we would not recommend placing pending orders at either of the above said barriers as you’re potentially opening yourself up to the possibility of getting faked out. Waiting for lower timeframe confirmation is, in our opinion, the best path to take. Confirmation for our team is either a break of a supply/demand followed by a subsequent retest, a trendline break/retest or simply a collection of well-defined buying/selling tails/wicks around the higher timeframe level.
Levels to watch/live orders:
- Buys: 1.0940 region [Tentative – confirmation required] (Stop loss: dependent on where one confirms this area).
- Sells: 1.1162 region [Tentative – confirmation required] (Stop loss: dependent on where one confirms this area).
GBP/USD:
Weekly gain/loss: – 687 pips
Weekly closing price: 1.3659
Weekly opening price: 1.3422
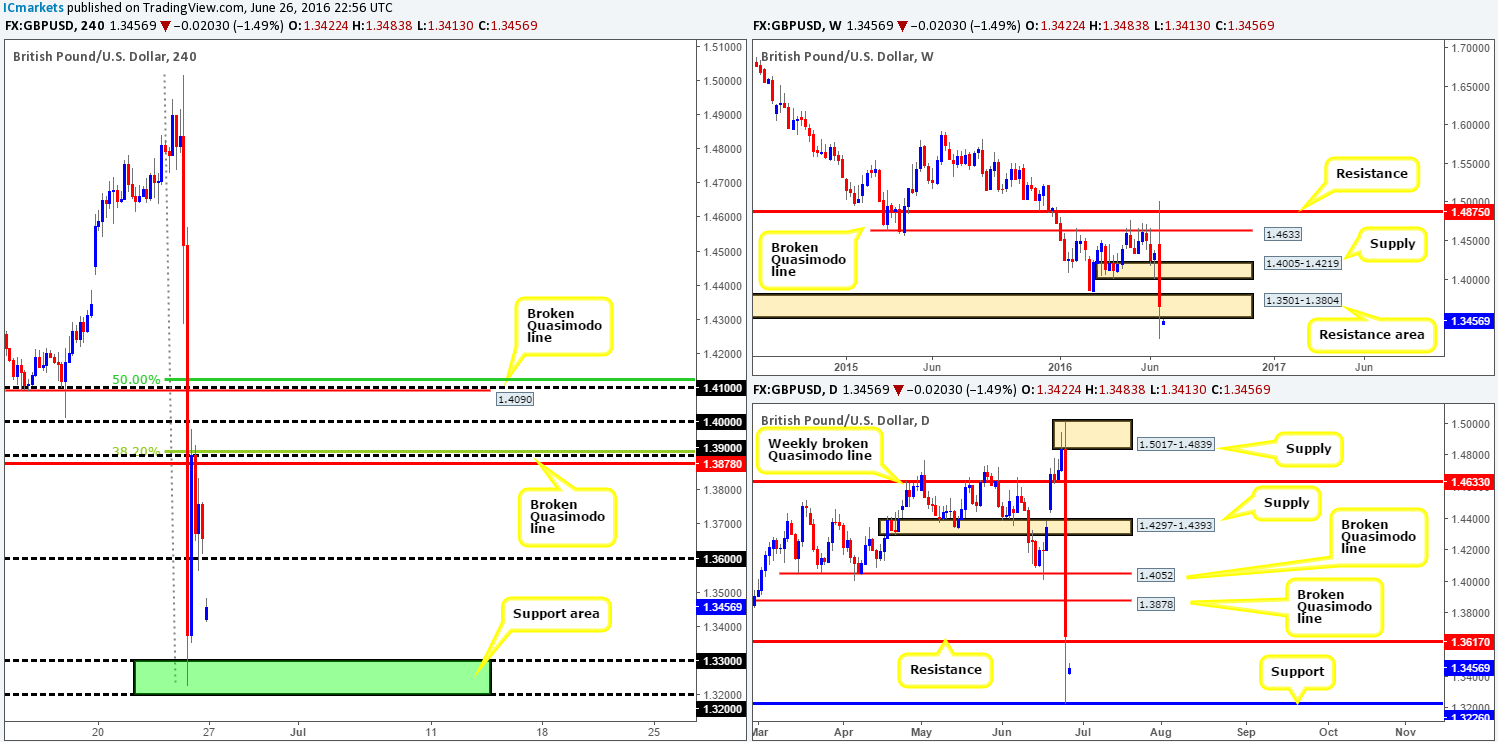
Weekly view: From this viewpoint, we can see that last week’s action saw price aggressively whipsaw through 1.4633 (broken Quasimodo line) and tag weekly resistance at 1.4875, before crashing over 1350 pips by the close! This increased volatility came after the UK decided to leave the EU, which followed with David Cameron resigning as Prime Minister. The week ended closing within a weekly support area at 1.3501-1.3804, which is now a potential resistance zone thanks to this week opening 237 pips lower!
Daily view: The story on the daily chart shows that price found support around 1.3226 on Friday, which, as you can see, managed to bolster price enough to claw back some of the day’s losses. However, in light of this morning’s open, cable is now seen loitering mid-range between daily support at 1.3226 and daily resistance drawn from 1.3617. Both levels, in our opinion, hold the same weight, so do make sure to keep a close tab on both barriers this week.
H4 view: A quick recap of Friday’s trade on the H4 shows price found support in between 1.32/1.33 (green rectangle). This saw the pair retreat back up to the 1.39 handle which held price lower. Coupled with a H4 broken Quasimodo line at 1.3878 and a H4 Fib resistance level at 1.3912, 1.39 managed to push this market back down to the 1.36 region by the day’s close.
In that the structure on this chart is somewhat chaotic at the moment, along with this morning’s open being extremely aggressive, we only have our eye on two areas at this time:
- The H4 support area at 1.32/1.33. This is simply because it was here that the GBP was able to reverse amid Friday’s chaotic selling.
- The 1.36 handle. Not only did this number hold as support going into last week’s close, but it also sits within the weekly resistance area at 1.3501-1.3804 and is located nearby daily resistance at 1.3617.
Our suggestions: Much like the EUR/USD chart above, we would strongly recommend only trading the aforementioned levels if lower timeframe confirmation is seen beforehand (see the top of this report for confirming techniques), since getting caught on a fakeout only to then see price hit take-profit is extremely frustrating.
Levels to watch/live orders:
- Buys: 1.32/1.33 [Tentative – confirmation required] (Stop loss: dependent on where one confirms this area).
- Sells: 1.36 region [Tentative – confirmation required] (Stop loss: dependent on where one confirms this area).
AUD/USD:
Weekly gain/loss: + 74 pips
Weekly closing price: 0.7469
Weekly opening price: 0.7415
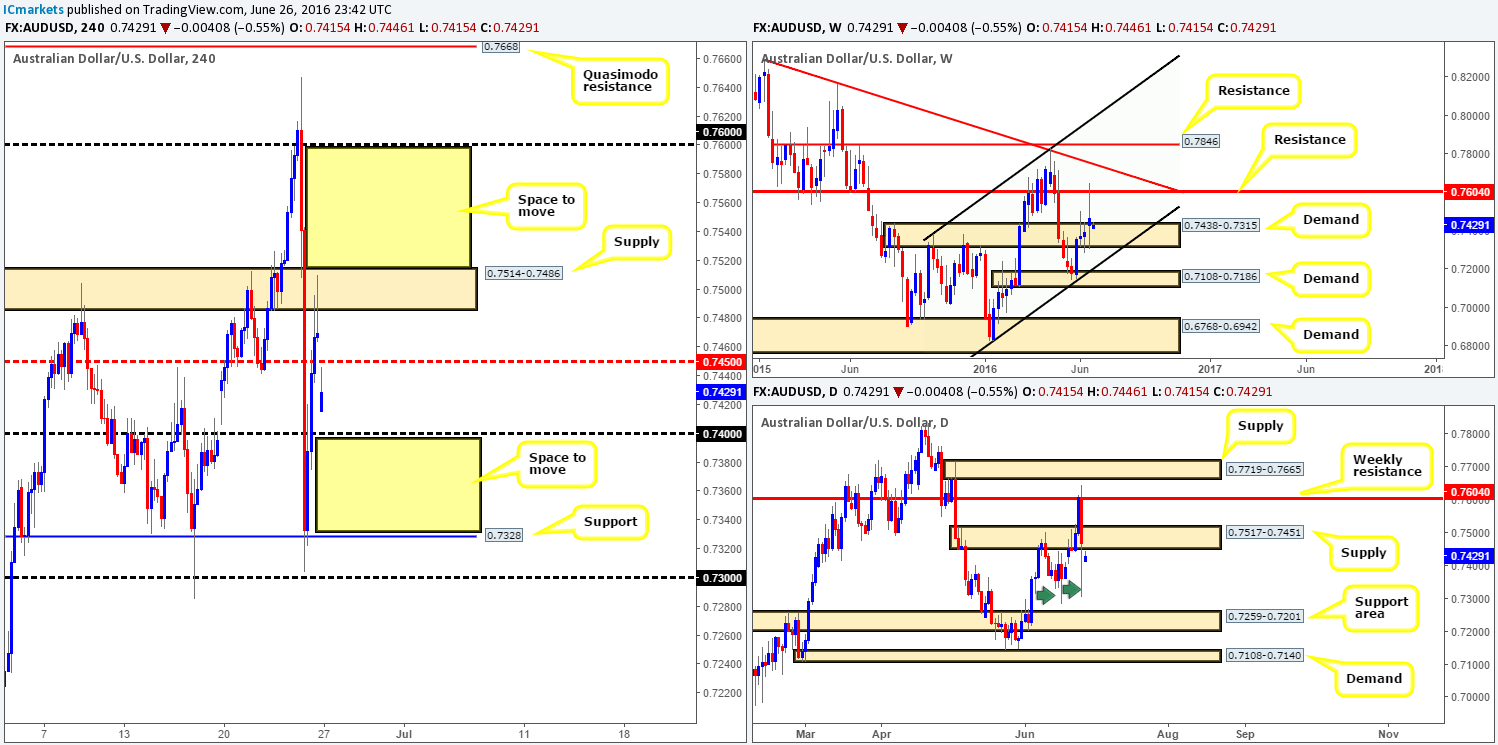
Weekly view: Despite all the commotion surrounding the EU referendum on Friday, weekly structure remained intact. Weekly resistance at 0.7604 was, as you can see, hit during ‘Brexit’, consequently forcing buyers back down to the top-side of weekly demand at 0.7438-0.7315. In the event that the bears continue to dig lower from here, we could see the commodity currency touch base with weekly trendline support extended from the low 0.6827 sometime this week.
Daily view: Looking down to the daily chart, however, the Aussie is seen trading beneath a daily supply zone coming in at 0.7517-0.7451 thanks to this morning’s fifty-pip gap lower. Should this daily supply hold this week, there is very little active demand seen below until price connects with the daily support area penciled in at 0.7259-0.7201. The reasoning behind our current line of thought stems from the two daily tails marked with green arrows at 0.7285/0.7304. These tails, at least in our view, highlight consumption. In other words both tails have already likely consumed the majority of bids around this area thus the path south is potentially clear down to the daily support area we just mentioned above at 0.7259-0.7201.
H4 view: A brief look at recent dealings on the H4 chart shows H4 support at 0.7328 held steady during ‘Brexit’ selling. From here, the buyers took out the 0.74 handle as well as the H4 mid-way resistance line at 0.7450, allowing price to challenge H4 supply at 0.7514-0.7486 going into the close.
In view of this morning’s gap lower, price is now seen loitering between 0.74/0.7450. Technically, this pair is a little tricky at the moment. On the one hand we have weekly demand in play, and on the other hand, daily supply, which shows room for price to move lower, is also now in view (see above).
Our suggestions: Given the above points, neither a long nor short seems attractive at this point in time. However, we do like the space seen above the H4 supply and also below the 0.74 handle (see yellow boxes). To trade beyond these barriers, however, we would firstly need to see price not only close beyond the aforementioned areas, but also retest them followed by a lower timeframe signal (see the top of this report for confirming techniques). The reason for requiring lower timeframe confirmation here simply comes down to the higher timeframe structure (see above in bold).
Levels to watch/live orders:
- Buys: Watch for price to consume H4 supply at 0.7514-0.7486 and look to trade any retest seen thereafter (lower timeframe confirmation required).
- Sells: Watch for price to consume 0.74 and look to trade any retest seen thereafter (lower timeframe confirmation required).
USD/CAD:
Weekly gain/loss: + 99 pips
Weekly closing price: 1.2987
Weekly opening price: 1.3044
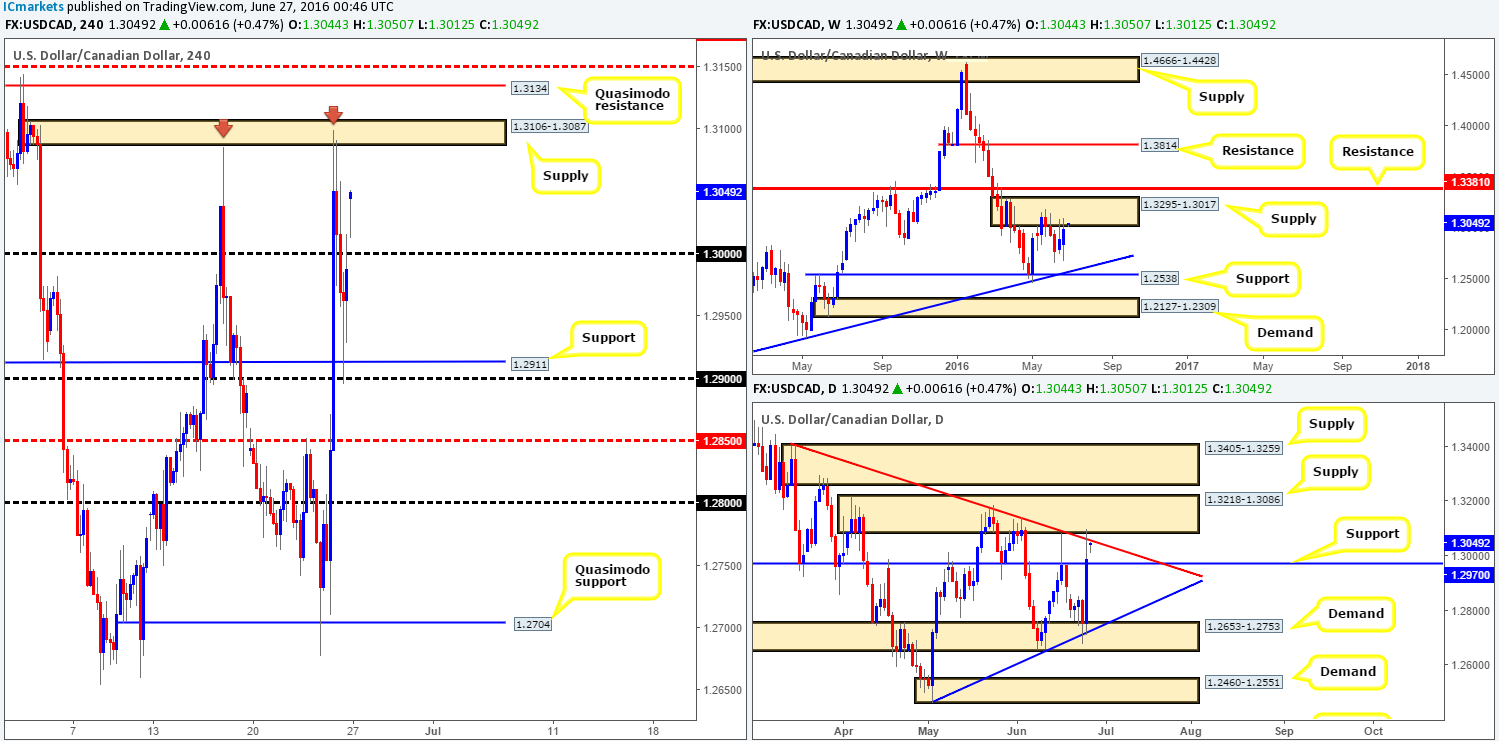
Weekly view: From the weekly picture this morning, it is clear to see that weekly supply at 1.3295-1.3017 held the bulls lower last week. This supply, although only a relatively newly-formed area, has managed to cap upside in this market since the 16th May. The next upside target beyond this zone sits relatively close by at 1.3381 – a weekly resistance line, while to the downside the next target can be seen at a weekly support line drawn from 1.2538 (coincides with a weekly trendline support extended from the high 1.1278).
Daily view: In conjunction with weekly price, the daily chart shows that the buyers and sellers are seen battling for position around the underside of a daily supply base at 1.3218-1.3086 (merges with daily trendline resistance taken from the high 1.3405). Before we all go and punch the sell button, however, do bear in mind that downside potential is limited on the daily scale, as support sits just below at 1.2970.
H4 view: The USD/CAD, as can be seen from the H4 chart, extended gains from the H4 Quasimodo support at 1.2704. Backed by the ‘Brexit’ situation triggering on Friday, the pair whipped through several H4 resistances before rebounding from H4 supply seen at 1.3106-1.3087.
Following a sixty-pip gap north this morning, the loonie is now seen lingering between the key figure 1.30 and the aforementioned H4 supply. Since we know that both the weekly and daily charts show price trading around supplies right now, we believe the best zone to look for shorts today is 1.3134 – a H4 Quasimodo resistance level. The reason for choosing this line over the current H4 supply base is simply because this area has been visited twice already and will likely give way on the third touch.
Our suggestions: Given the location of the H4 Quasimodo line at 1.3134 on the higher timeframe picture (see above), our team has placed a pending sell order at 1.3133 with a stop set at 1.3160 (ten pips above the H4 mid-way resistance at 1.3150). Should all go to plan and price move lower here, the first take-profit barrier will be the 1.31 handle which is where we’ll also look at reducing risk to breakeven.
Levels to watch/live orders:
- Buys: Flat (Stop loss: N/A).
- Sells: 1.3133 [Pending order] (Stop loss: 1.3160).
USD/CHF:
Weekly gain/loss: + 111 pips
Weekly closing price: 0.9705
Weekly opening price: 0.9752
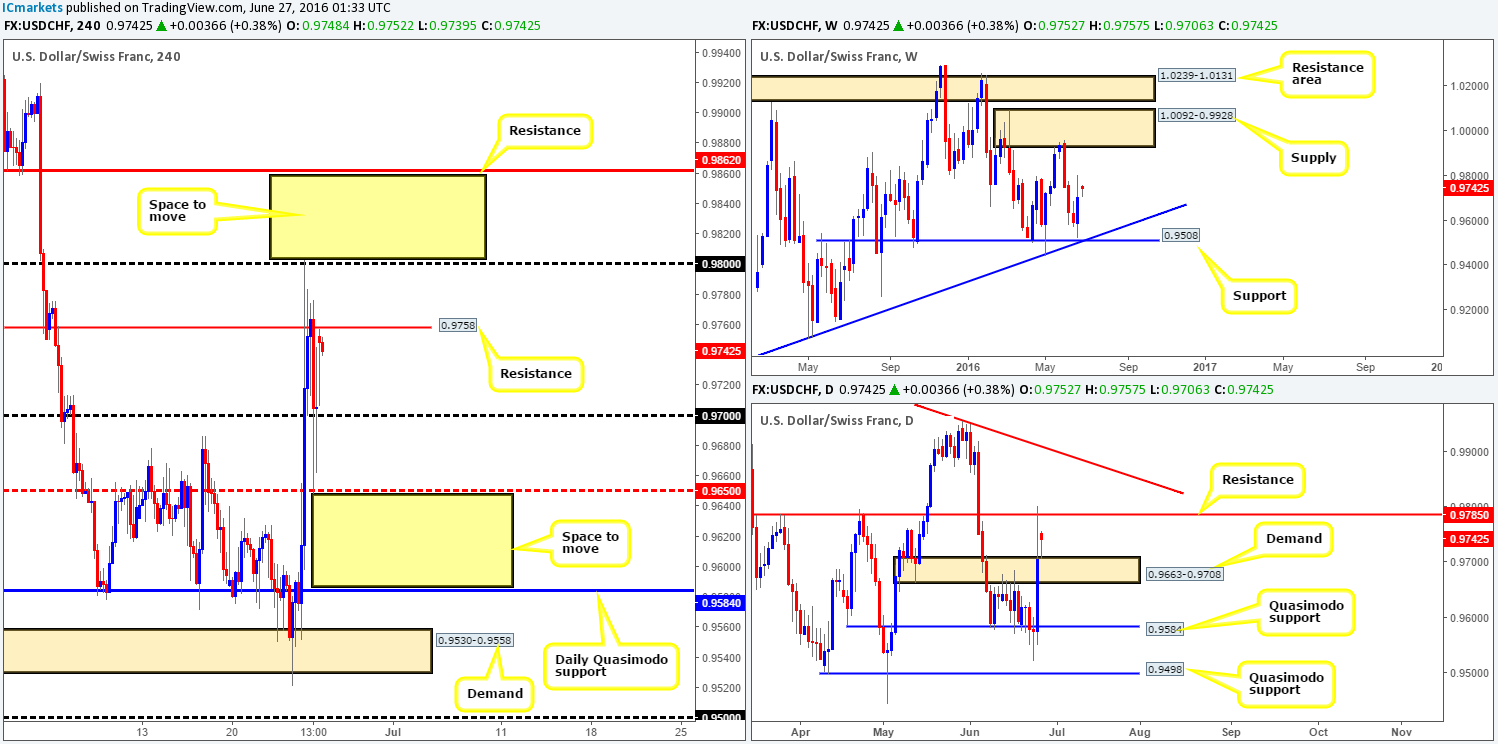
Weekly view: Given that the GBP fell sharply along with the EUR on Friday as Britain voted to leave the EU, the USD/CHF (an inversely correlated market to EUR and GBP related pairs) rallied higher. Consequent to this, a weekly bullish engulfing candle formed, just missing the weekly support barrier at 0.9508 by only a few pips. As long as the bulls remain dominant this week there is a possibility we may see the Swissy continue to push higher and cross swords with weekly supply at 1.0092-0.9928.
Daily view: As things stand on the daily chart, however, the sell-side of this market appears to be in a relatively strong position at the moment. Daily resistance at 0.9785 has, at least in our book, stood the test of time and is not a line one can ignore simply because the weekly shows room to move higher (see above).
H4 view: Looking at Friday’s action on the H4 chart shows that the day began extremely bullish, pushing the pair through multiple resistances before stabilizing around H4 resistance coming in at 0.9758. This morning’s gap which came close to fifty pips has, as can be seen from the chart, already been filled with price now seen loitering around the underside of the above said H4 resistance.
Selling from 0.9758 or even the 0.98 handle above is not something our team would stamp high probability this week due to the daily resistance registered at 0.9785! Therefore, for longs, we would recommend waiting for a close above 0.98 followed by a retest before one begins hunting for buy trades, since there is space for price to run north up to H4 resistance at 0.9862. As for shorts, we would not propose selling until a close beyond the H4 mid-way support at 0.9650 is seen. A close below here will not only push this market through the current daily demand zone, but also open the path lower down to the daily Quasimodo support at 0.9584 – essentially the next downside target on the daily timeframe.
Our suggestions: Before one considers trading either of the above said levels, our team has pointed out that waiting for lower timeframe confirmation to form beforehand is extremely important! Not only will this likely avoid any whipsaws through your level but could also save you from an unnecessary loss. For those interested in looking to confirm your levels before trading them, see the top of this report.
Levels to watch/live orders:
- Buys: Watch for price to consume 0.98 and look to trade any retest seen thereafter (lower timeframe confirmation required).
- Sells: Watch for price to consume 0.9650 and look to trade any retest seen thereafter (lower timeframe confirmation required).
DOW 30:
Weekly gain/loss: – 318 points
Weekly closing price: 17333
Weekly opening price: 17278
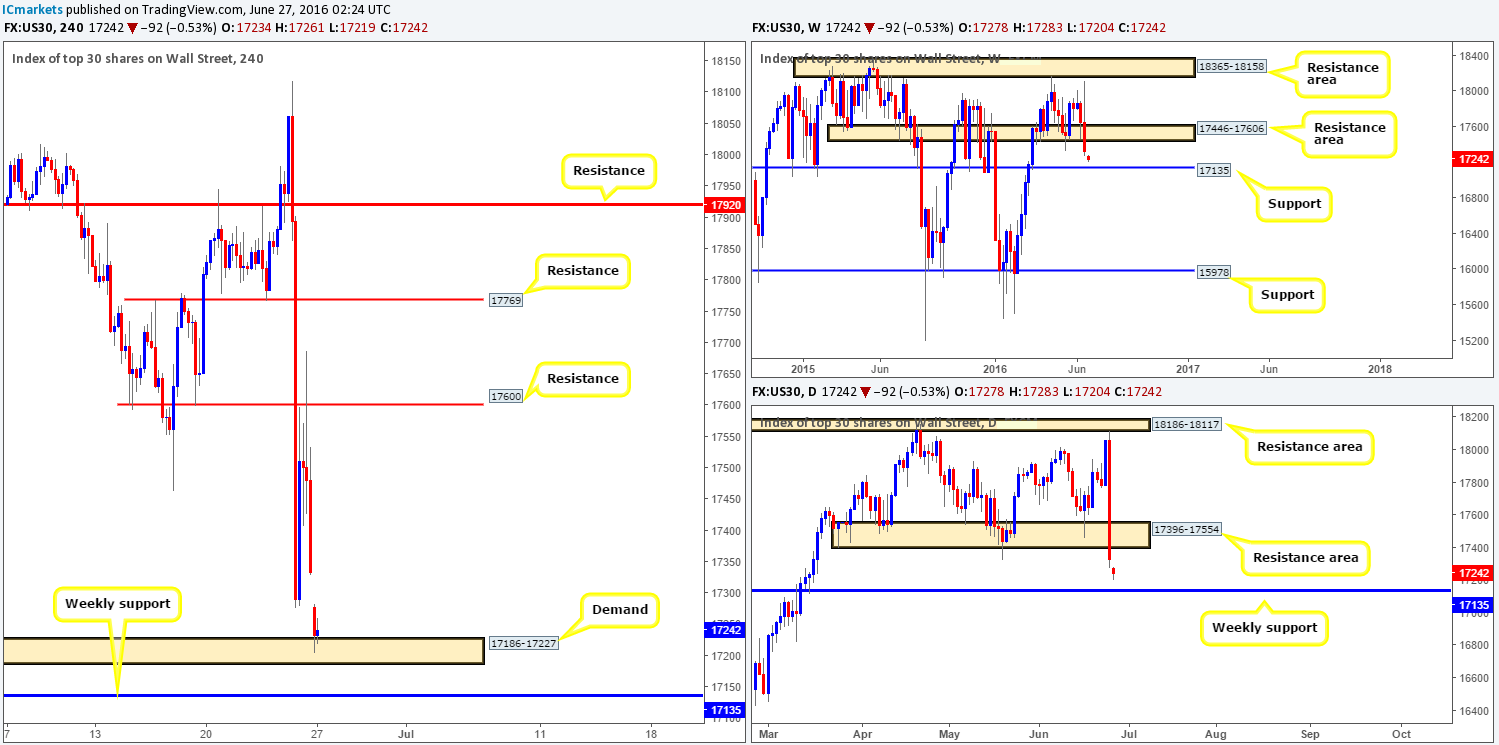
Weekly view: With the weekly support area at 17446-17606 now out of the picture (acting resistance zone), it looks as though the DOW may be heading south to shake hands with weekly support at 17135 sometime this week. Other than the last couple of times this support line has been visited, a reaction has always been seen. Therefore, it is certainly a hurdle to keep an eyeball on this week!
Daily view: In similar fashion to the weekly chart, daily action shows price to have taken out a daily support area at 17396-17554 (now acting resistance zone). What is more, there is very little daily support to the left of current price stopping this index from connecting with the aforementioned weekly support line.
H4 view: Leaning over to the H4 chart, we can see that US stocks suffered on Friday as the UK decided to leave the EU. Price found support around the 17277 region, which then whipsawed this unit back up to retest H4 resistance at 17600 before crashing lower once more to close at 17333.
Moving into a new week, the DOW went on to gap around sixty points lower this morning, bringing price into the jaws of a H4 demand area at 17186-17227. Although bids are holding firm here for the time being, we doubt this area will hold out for much longer considering that both the weekly and daily charts show room to move lower to the weekly support at 17135.
Our suggestions: Quite frankly, the only barrier we’re interested in at the moment is the weekly support level at 17135. A fake below the current H4 demand will likely trigger a truckload of sell stops, which, as most already know, is liquidity for well-funded traders to buy into. However, in that this is a fixed line one needs to expect a fakeout as price rarely reacts to the pip at a level. As such, our team will only trade this weekly number should a lower timeframe buy signal be seen (see the top of this report for confirming techniques).
Levels to watch/live orders:
- Buys: 17135 region [Tentative – confirmation required] (Stop loss: dependent on where one confirms this area).
- Sells: Flat (Stop loss: N/A).
Gold:
Weekly gain/loss: + $16.8
Weekly closing price: 1314.3
Weekly opening price: 1318.6
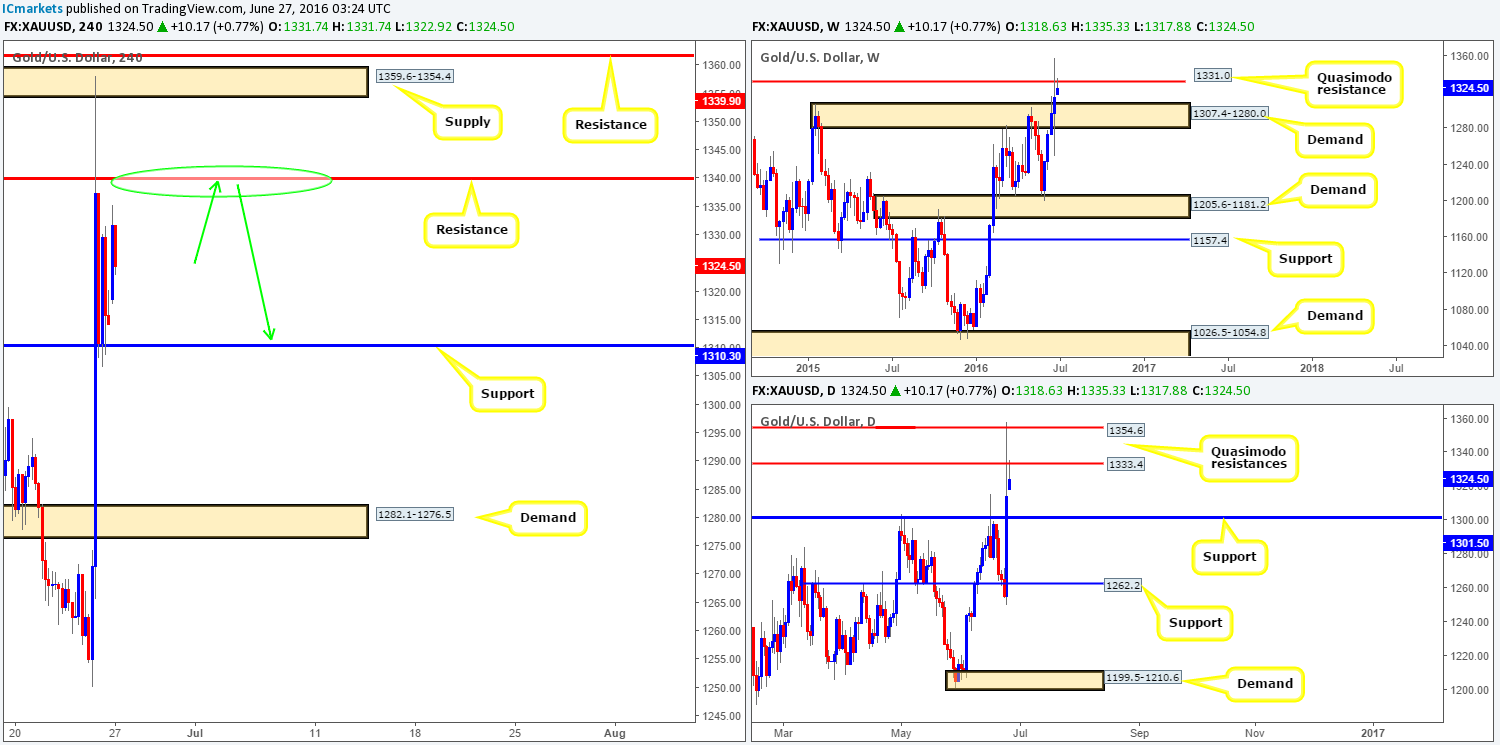
Weekly view: Despite the yellow metal punching to highs of 1358.1 last week, price only managed to close a mere $17 higher than the previous close. What this also did, however, was consume weekly supply at 1307.4-1280.0 (now acting demand) and go on to tag the weekly Quasimodo resistance line at 1331.0.
Daily view: Besides weekly offers holding firm around the weekly Quasimodo resistance at 1331.0, we can also see that daily price came into contact with two daily Quasimodo resistances at 1354.6/1333.4. A sell-off from this base would likely bring gold down to daily support at 1301.5 – a line that sits within the weekly demand area seen at 1307.4-1280.0 (the next downside target on the weekly timeframe).
H4 view: Safe-have flows saw gold heavily-bid in the early hours of Friday’s sessions. Price wiped out a considerable amount of H4 resistances, before stabilizing around a small H4 supply area at 1359.6-1354.4 and dropping down to a H4 support at 1310.3.
Owing to recent price action, this market, despite opening $4 higher this morning, is effectively confined between a H4 resistance at 1339.9 and the H4 support we just mentioned above at 1310.3.
Our suggestions: In light of the points made above, we currently have our eye on the following levels for sells:
- The current H4 resistance (green circle). Granted, there is very little converging H4 structure to support this resistance, but given its position on the higher timeframe scale (see above) a short from here (with lower timeframe confirmation) is a high-probability sell in our book. The first take-profit target from this angle would be the H4 support at 1310.3, followed closely by the top-side of weekly demand at 1307.4.
- We also like the look of the H4 supply area at 1359.6-1354.4. Not only did this zone stop Friday’s Bull Run, but it also converges beautifully with the upper daily Quasimodo resistance line at 1354.6! We would recommend waiting for lower timeframe confirmation here since price is likely to fake through the H4 supply to a nearby H4 resistance at 1361.7.
For those interested in confirming the above said levels, please see the top of this report.
Levels to watch/live orders:
- Buys: Flat (Stop loss: N/A).
- Sells: 1339.9 region [Tentative – confirmation required] (Stop loss: dependent on where one confirms this area). 1359.6-1354.4 [Tentative – confirmation required] (Stop loss: dependent on where one confirms this area).
