EUR/USD:
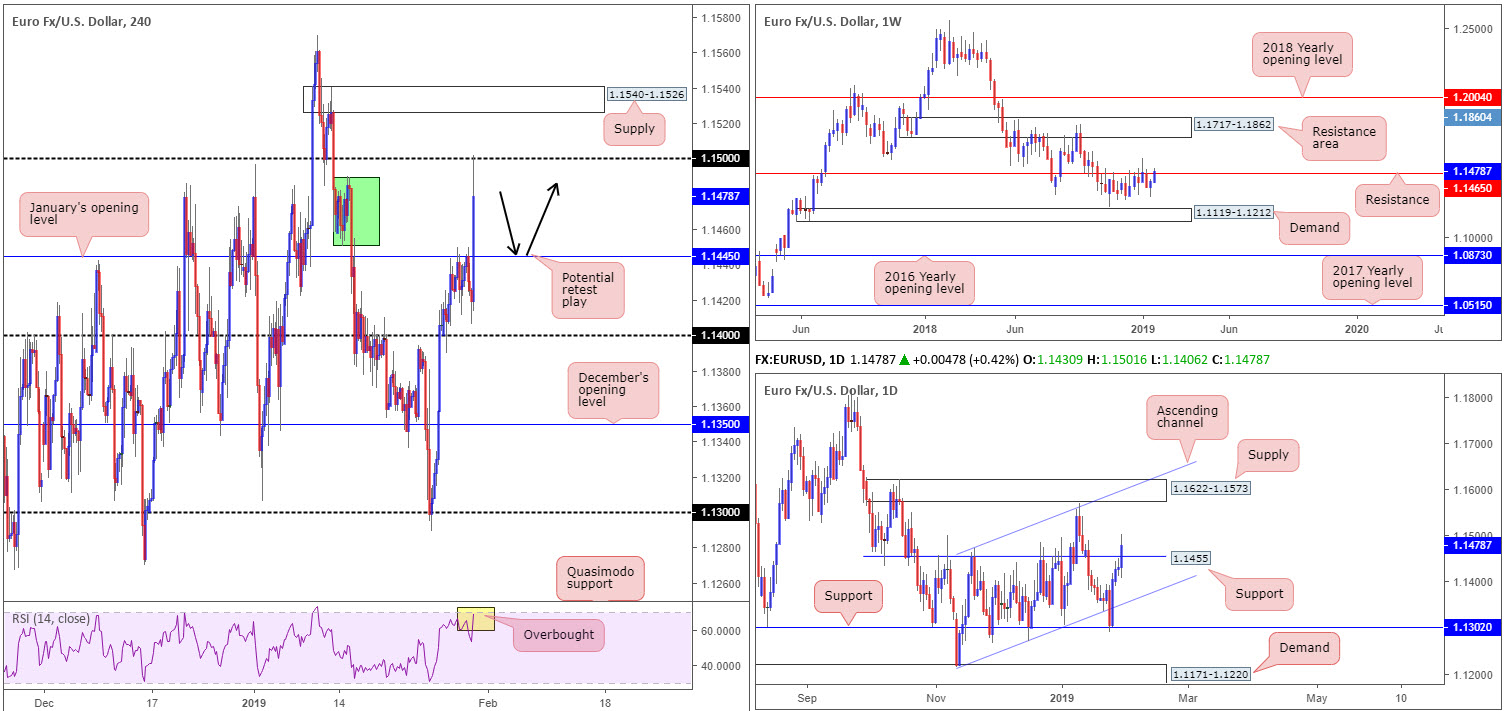
Wednesday’s market spent a large portion of its day meandering beneath January’s opening level at 1.1445 on the H4 timeframe, despite German prelim CPI figures reporting a better-than-expected month, and ADP non-farm employment change out of the US also thumping market estimates.
On the much awaited FOMC rate decision holding pat in recent hours, dovish tweaks in the latest FOMC statement and Fed’s Powell stance shifting more dovish, the greenback fell sharply, printing fresh lows at 95.25. Dollar selling boosted demand for the euro, lifting the EUR/USD to session highs just north of the 1.15 handle before mildly paring gains into the closing bell.
Daily players nudged above its resistance level priced in at 1.1455 (now acting support), potentially exposing supply coming in at 1.1622-1.1573 that converges closely with channel resistance (extended from the high 1.1472). Weekly price also overthrew nearby resistance at 1.1465. In the event this triggers a round of continuation buying, upside appears free until a resistance area drawn from 1.1717-1.1862 enters the fold.
Areas of consideration:
Having seen H4 sellers fade 1.15 after tripping stops above the large green H4 supply at 1.1489, today’s movement could witness a retracement towards January’s opening level mentioned above at 1.1445. This level, given its close connection to daily support at 1.1455 and weekly resistance at 1.1465, likely contains active buyers.
Whether traders feel 1.1445 warrants additional confirmation before identifying it as valid support is, of course, down to the individual trader. Waiting for bullish candlestick confirmation, according to our research team, is worth considering, however, as the pattern helps provide entry and stop parameters to work with around the support.
Today’s data points: EUR Prelim Flash GDP q/q; German Buba President Weidmann Speaks; US Employment Cost Index q/q; Chicago PMI.
GBP/USD:
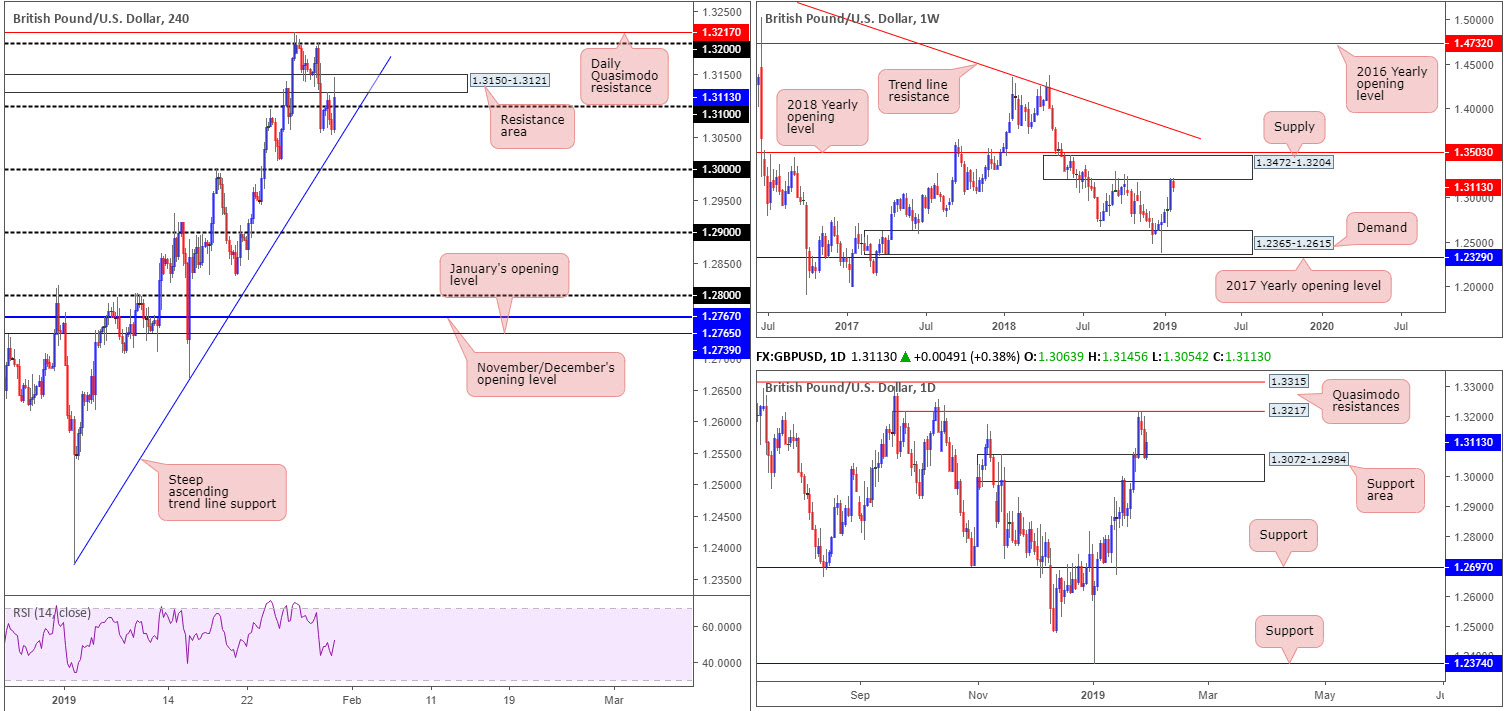
Brexit jitters capped upside Wednesday, despite the dollar’s recent collapse on the back of latest FOMC movement. H4 sellers entered the fold out of the resistance area coming in at 1.3150-1.3121, following an FOMC-induced rally through orders around 1.31.
H4 structure, as you can probably see, is restricted. The noted H4 resistances mentioned above are holding buyers at bay, while to the downside, a nearby steep trend line support is seen (extended from the low 1.2373). Beyond this barrier, limited support is visible until key figure 1.30 enters the mix.
In addition to the above, higher-timeframes areas also offer a mixed view. Weekly price action is seen engaging with the lower boundary of supply drawn from 1.3472-1.3204. Tailed closely by a 2018 yearly opening level at 1.3503, the current supply, which already capped upside successfully once already in October 2018, houses a healthy chance of repeating history here. A closer reading of the market, however, reveals recent selling pressured price action towards a support area coming in at 1.3072-1.2984, which has held ground thus far. The important thing to consider here is the daily area fuses nicely with the steep H4 trend line support mentioned above, as well as the 1.30 handle.
Areas of consideration:
According to our technical studies of all three timeframes, neither a long nor short appears attractive at the moment. Irrespective of the direction one selects, you’ll face opposing structure. For that reason, opting to remain on the sidelines, at least from a medium-term perspective, may be the best path to take right now.
Today’s data points: US Employment Cost Index q/q; Chicago PMI.
AUD/USD:
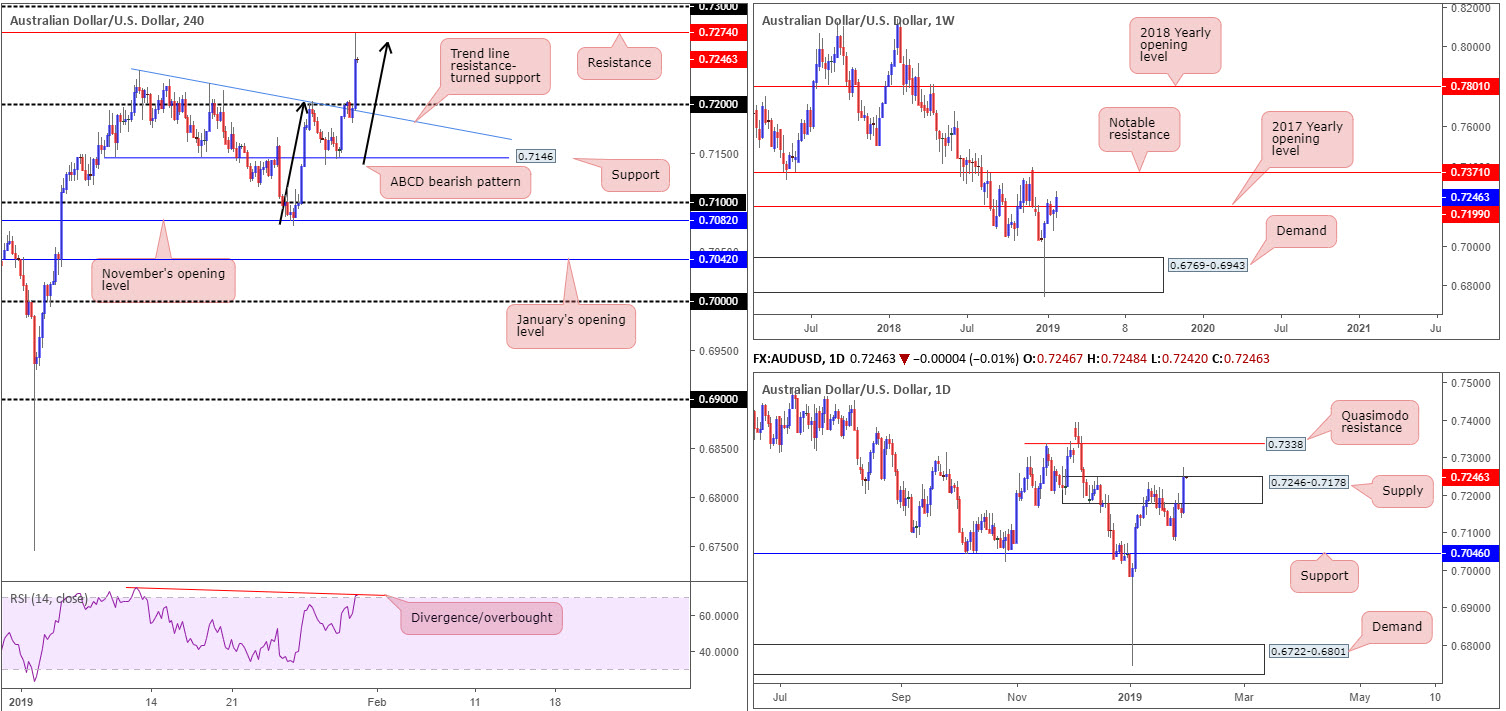
The Australian dollar rose in reply to a dovish FOMC Wednesday, building on recent gains to a session high of 0.7273.
Through the simple lens of a technical trader, the H4 candles destroyed offers around 0.72 and concluded the day mildly trimming gains south of 0.7274: a resistance level. What’s interesting here is H4 price also finalised a bearish ABCD pattern (black arrows) at 0.7264. A rotation lower from this angle has 0.72 to target, shadowed closely by a trend line resistance-turned support (extended from the high 0.7235). Another key thing to note on the H4 scale is the RSI indicator is seen displaying a divergence/overbought reading.
On a wider perspective, nevertheless, the pair reflects more of a bullish stance. Weekly flow, thanks to yesterday’s buying, took out resistance at 0.7199: the 2017 yearly opening level and perhaps unlocked the pathway north towards notable resistance at 0.7371. The story on the daily timeframe has the pair cycling around the top limit of its supply stationed at 0.7246-0.7178. This move likely filled stop-loss orders from a large portion of traders short here and filled a number of breakout buyers here, too. The next port of call beyond these walls falls in at a Quasimodo resistance level at 0.7338.
Areas of consideration:
Assuming the higher-timeframe analysis is accurate, selling H4 structure is difficult towards 0.72. Should the market chalk up a bearish candlestick signal from this neighbourhood (entry/stop parameters can be defined according to this pattern), however, it may be worth the risk, as long as risk/reward parameters are correctly factored into the trade.
Directly above the H4 resistance mentioned above at 0.7274, traders might also want to note possible selling pressure waiting around the 0.73 handle.
Today’s data points: US Employment Cost Index q/q; Chicago PMI.
USD/JPY:
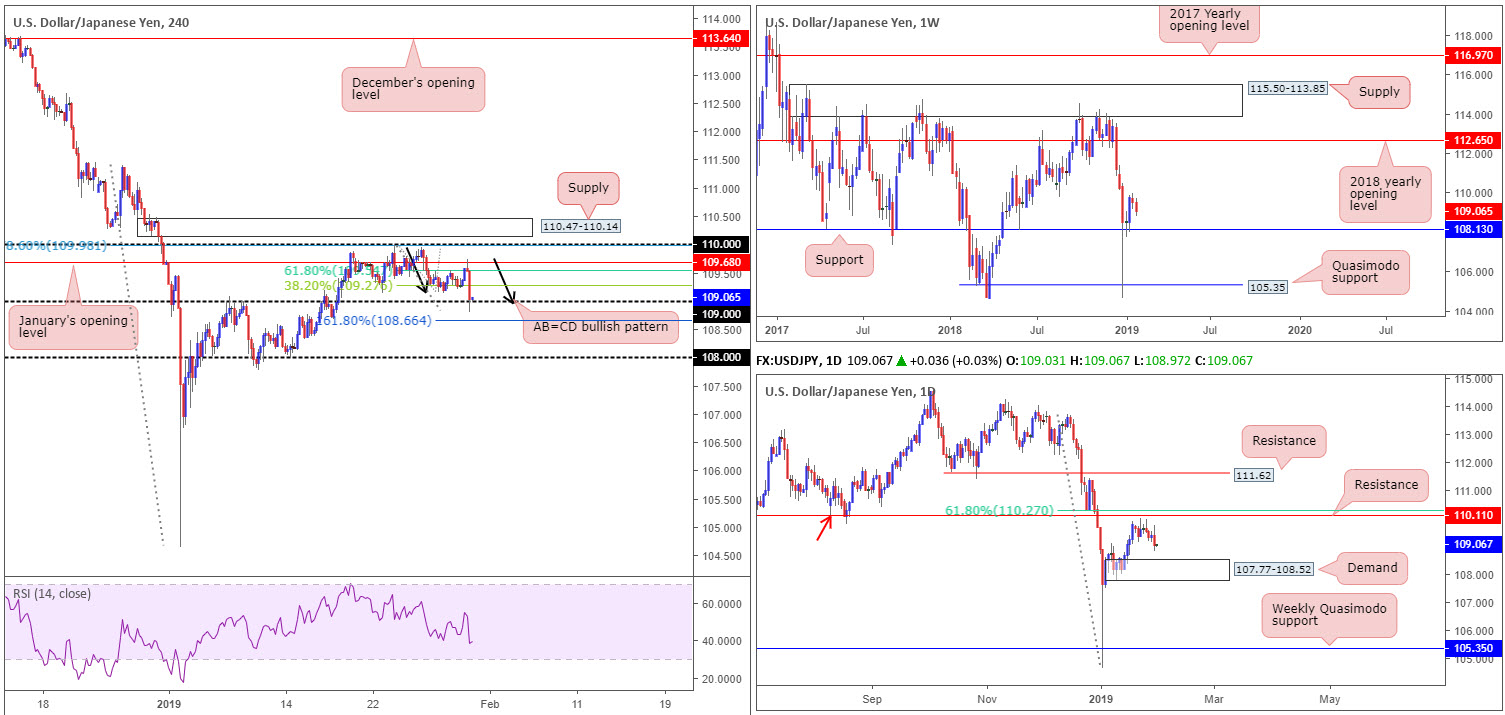
H4 sellers elbowed their way into the spotlight Wednesday, following a retest at the underside of January’s opening level at 109.68 in the shape of a bearish pin-bar formation. In one fell swoop, fuelled by a dovish FOMC, the USD/JPY sank to a two-week low south of the 109 handle. What’s also notable from a technical viewpoint is the recently completed AB=CD bullish pattern (black arrows) around 109.
Although we have support establishing itself on the H4 timeframe, buying could prove troublesome for some traders having seen daily flow display scope for further selling towards demand coming in at 107.77-108.52 by way of a bearish engulfing formation. What’s also interesting is weekly price shows room to press as far south as support at 108.13 (positioned within the parapets of the current daily demand).
Areas of consideration:
With stop-loss orders either tucked beneath the H4 161.8% Fibonacci ext. point at 108.66 or yesterday’s low 108.80, there’s a high probability the market will rotate north from 109 towards at least the 38.2% Fibonacci resistance value of the A-D leg (from the AB-CD pattern highlighted above) at 109.27, with the possibility of also testing 109.54: the 61.8% Fibonacci resistance value of the A-D leg. Reasonable risk/reward is available as long as traders adopt sound trade management principles, despite both weekly and daily flow indicating a move to the downside may be in store.
Today’s data points: US Employment Cost Index q/q; Chicago PMI.
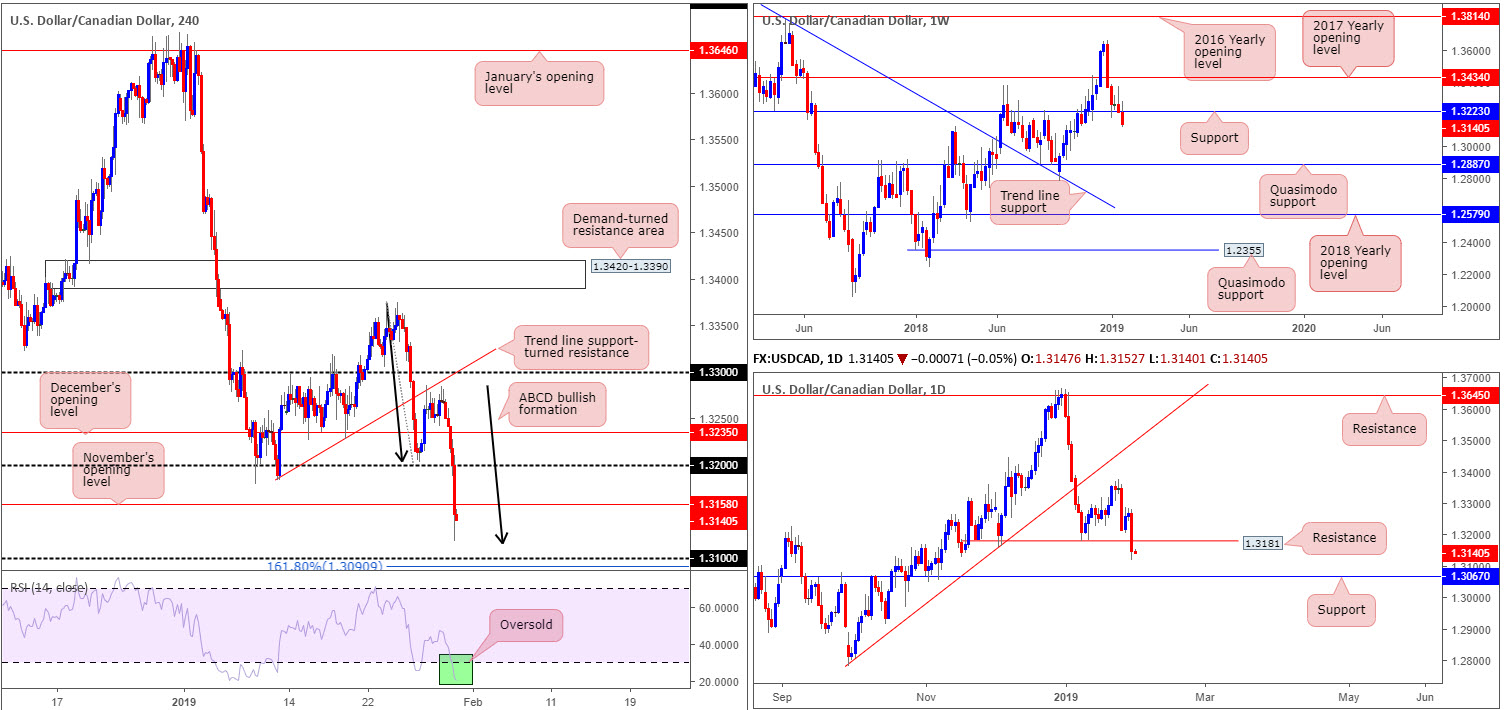
USD/CAD:
The US dollar relinquished further ground to the Canadian dollar Wednesday, weighed on by broad-based USD selling, influenced largely by a dovish FOMC, and WTI extending gains above $54.
Technically speaking, recent selling dragged weekly price beyond its support level at 1.3223, opening up downside to additional selling as far south as Quasimodo support at 1.2887. Taking form of a near-full-bodied daily bearish candle, daily price also cleared orders from Quasimodo support at 1.3181 (now acting resistance) and now eyeing notable support priced in at 1.3067.
A closer look at price action on the H4 timeframe highlights yesterday’s precipitous decline, sinking a number of key support levels along the way. Technicians, in particular Harmonic traders, may be interested to note selling formed a nice-looking ABCD bullish pattern, with waves A-B of a similar length to C-D, north of 1.31. According to the research team, it’s possible the H4 candles may continue to press for lower ground to bring in buyers from 1.31, given the 161.8% Fibonacci ext. point is seen ten pips south of this level at 1.3090 (in connection with the current ABCD formation). Finally, it might also be worth taking into account the RSI indicator is trading deeply within oversold territory.
Areas of consideration:
On account of the above, both higher-timeframe charts portend further downside towards at least daily support at 1.3067. The flip side to this is H4 structure shows reasonably strong support off 1.31, which is likely to produce at least a bounce back up to November’s opening level at 1.3158. As round numbers are prone to whipsaws (or stop runs), waiting for a H4 bullish candlestick configuration to form is recommended before pressing the buy button. As long as entry based off the candlestick structure offers more than a 1:1 ratio in terms of risk/reward to 1.3158, this is a high-probability bounce.
Today’s data points: US Employment Cost Index q/q; Chicago PMI; Canadian GDP m/m; Gov. Council Member Wilkins Speaks.
USD/CHF:
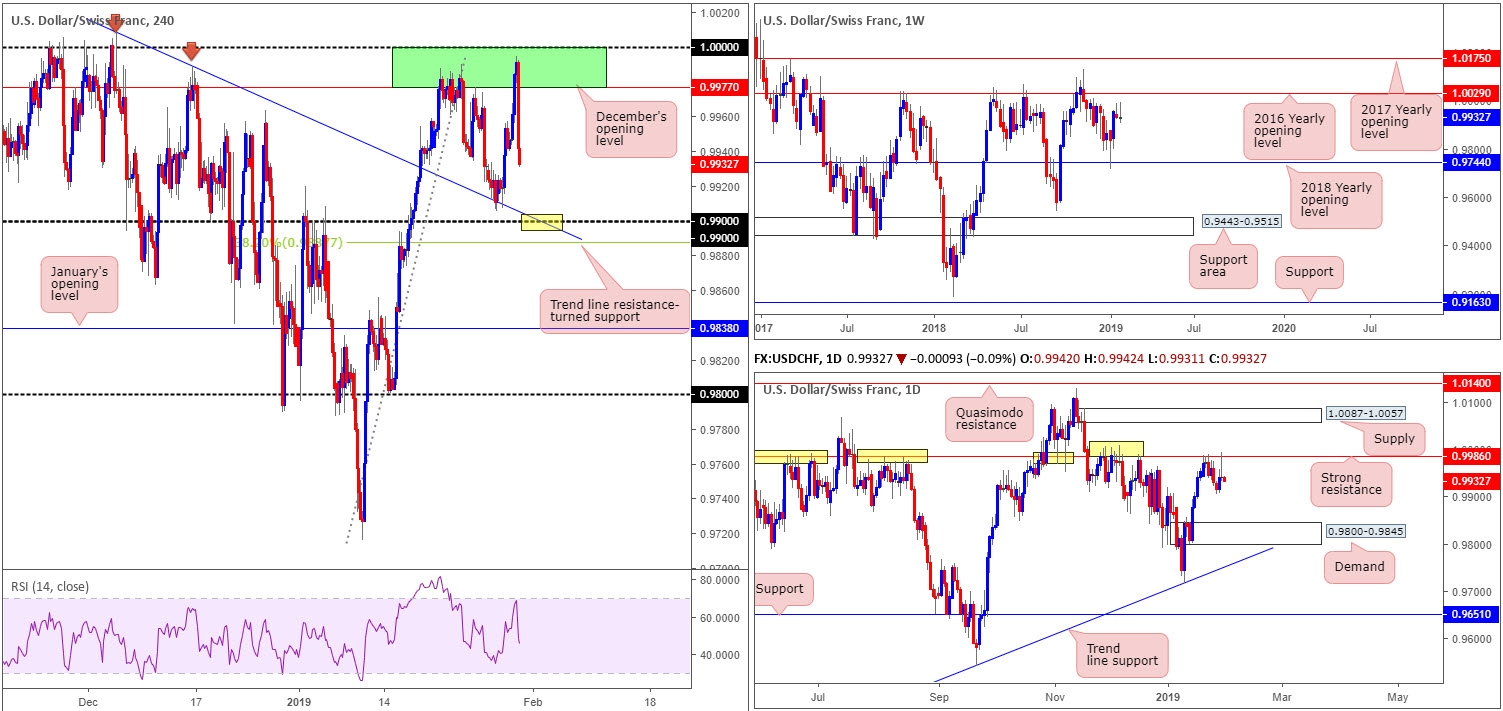
The USD/CHF lost momentum a few pips south of 1.0000 (parity) Wednesday, following the release of the much awaited FOMC rate decision, which held pat, as expected. Despite dovish tweaks in the latest FOMC statement and Fed’s Powell stance shifting more dovish exacerbating downside, the pair wrapped up the day unchanged.
The green area marked on the H4 timeframe between 1.0000 and December’s opening level at 0.9977, once again, held its ground. The research team likes this area due to its relationship with daily structure: the daily resistance level at 0.9986 is seen housed within its limits. Note this level was brought back into the mix yesterday and chalked up a strong bearish pin-bar configuration. It’s also interesting to observe weekly action in the process of constructing its second consecutive bearish pin-bar pattern, positioned south of the 2016 yearly opening level at 1.0029.
Further selling out of the H4 green zone at 1.0000/0.9977 has the 0.99 handle to target, which happens to merge nicely with H4 trend line resistance-turned support (extended from the high 1.0008).
Areas of consideration:
The point at which the 0.99 handle fuses with the H4 trend line resistance-turned support mentioned above (yellow) has ‘bounce’ written all over it. We also like the nearby 38.2% Fibonacci support value at 0.9887 hovering nearby the level. In fact, this could be used to determine stop-loss placement for longs off 0.99.
For conservative traders concerned regarding the market’s position on the higher timeframes, waiting for additional confirmation to form off 0.99 may be an idea. However, it must be stressed a bounce is all we feel will take shape from 0.99, therefore drilling down to the lower timeframes and searching for confirming action might be the best path to take in order to keep risk/reward parameters healthy.
Today’s data points: US Employment Cost Index q/q; Chicago PMI.
Dow Jones Industrial Average:
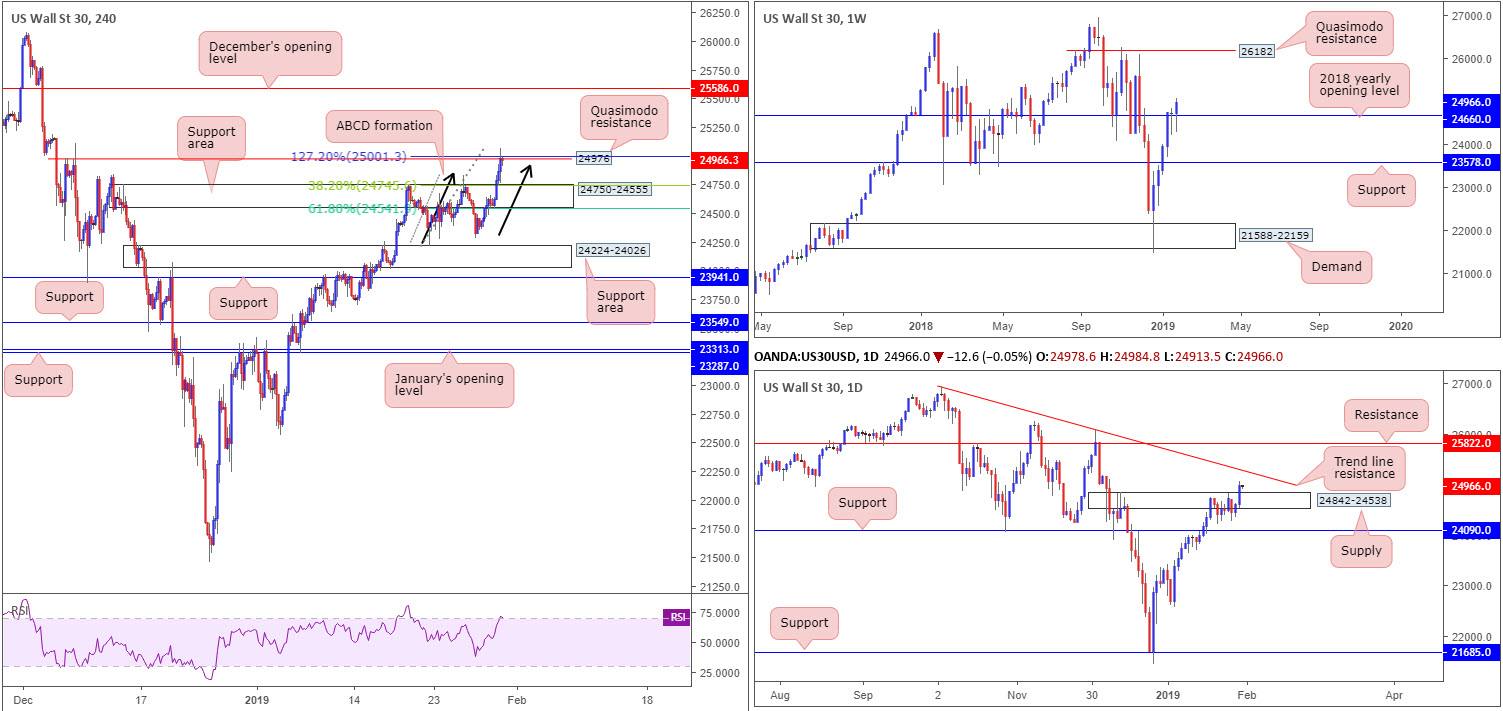
US equities advanced north Wednesday, extending Tuesday’s gains and also breaking free from a H4 consolidation (the top edge was a supply zone at 24750-24555, though now represents a support area) that capped upside since the 18th January. Another key point worth making on the H4 timeframe is the recently completed ABCD 127.2% bearish pattern (black arrows) that aligns beautifully with a H4 Quasimodo resistance at 24976 (25001), and the H4 RSI indicator displaying a divergence/overbought reading. Downside from this angle has two targets, according to traditional ABCD formations: the 38.2% Fibonacci support at 24745 and the 61.8% Fibonacci support at 24541, both set using the A-D legs. Note the two Fibs mark either side of the current H4 support area.
While H4 action appears poised to hit the brakes and reverse, higher-timeframe structure suggests gains are on the horizon. Weekly flow is establishing a floor above its 2018 yearly opening level at 24660. Further buying from this point could stretch as far north as Quasimodo resistance at 26182. Recent buying on the daily timeframe engulfed supply at 24842-24538, unlocking the door towards nearby trend line resistance (taken from the high 26939.
Areas of consideration:
Although selling the H4 Quasimodo resistance at 24976 places traders against higher-timeframe flow, a bounce lower, in view of its surrounding H4 confluence from an ABCD pattern, is likely to at least reach the 38.2% Fibonacci support at 24745 (effectively the top edge of the H4 support area at 24750).
In the event we break for higher ground, however, a long on the retest of 24976 is an option, targeting the daily trend line resistance mentioned above, followed by December’s opening level at 25586 on the H4 timeframe.
Today’s data points: US Employment Cost Index q/q; Chicago PMI.
XAU/USD (GOLD):
Up 1.20% on the week thus far and up 0.63% Wednesday, bullion is in fine form this week against a waning greenback.
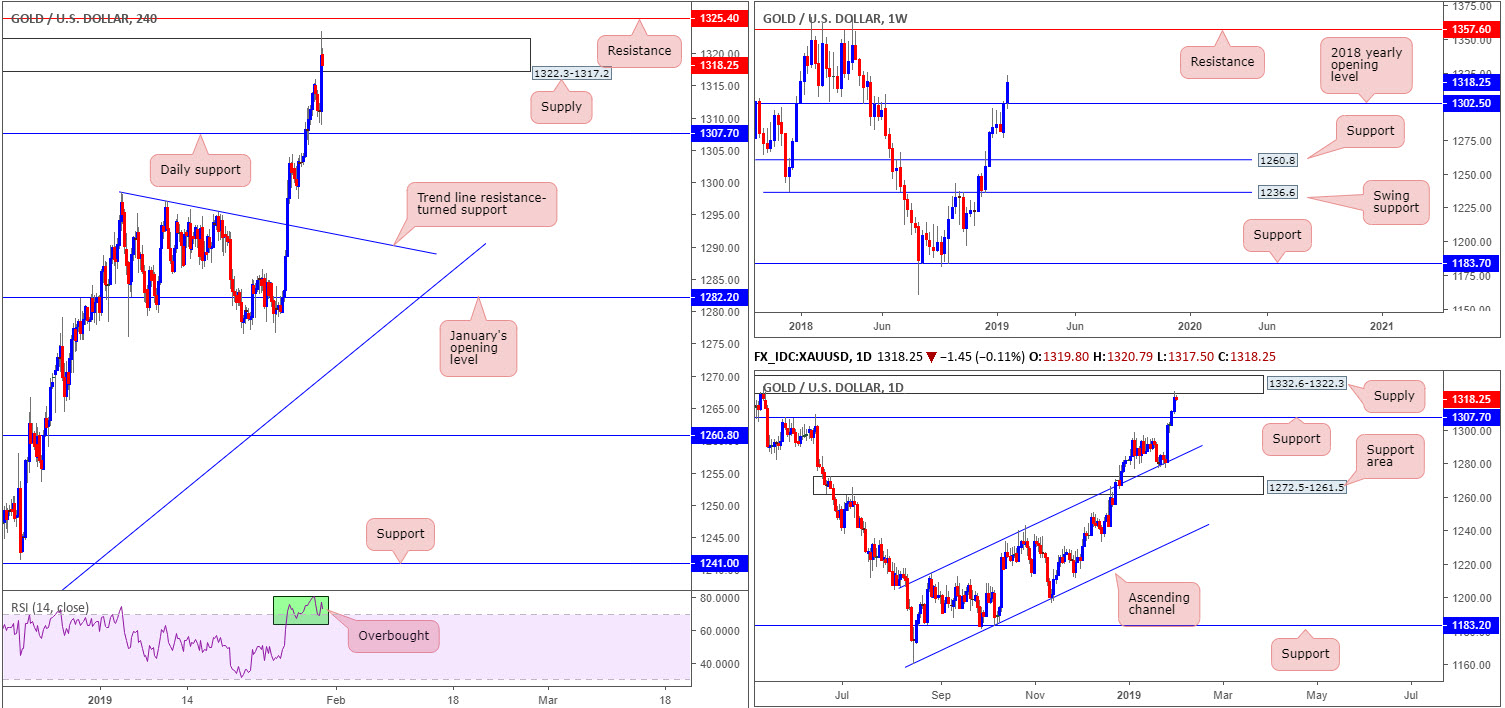
As underlined in yesterday’s report, weekly price recently conquered its 2018 yearly opening level at 1302.5, possibly freeing the runway north towards resistance marked at 1357.6. The key observation on the daily timeframe is price action shaking hands with supply priced in at 1332.6-1322.3. Note this supply area held price action lower in early May of 2018, proving its worth as a base for sellers.
Although we’re technically trading from daily supply right now, H4 supply at 1322.3-1317.2, a smaller base glued to the lower edge of the daily supply, suffered an upside breach following latest FOMC movement triggering a USD selloff. This potentially cleared sellers out of the H4 supply and opened up the path towards nearby H4 resistance at 1325.4.
Areas of consideration:
Having seen daily supply enter the mix, along with a H4 resistance level seen close by, the research team notes a pullback could be in store before continuing north, as suggested on the weekly timeframe. Should the market put in a retracement and break 1308.9 (yesterday’s low) to test daily support at 1307.7; this could, on the back of additional candlestick confirmation (entry/stop parameters defined according to this pattern) be an ideal location to join the uptrend, ultimately targeting weekly resistance highlighted above at 1357.6.
The use of the site is agreement that the site is for informational and educational purposes only and does not constitute advice in any form in the furtherance of any trade or trading decisions.
The accuracy, completeness and timeliness of the information contained on this site cannot be guaranteed. IC Markets does not warranty, guarantee or make any representations, or assume any liability with regard to financial results based on the use of the information in the site.
News, views, opinions, recommendations and other information obtained from sources outside of www.icmarkets.com.au, used in this site are believed to be reliable, but we cannot guarantee their accuracy or completeness. All such information is subject to change at any time without notice. IC Markets assumes no responsibility for the content of any linked site. The fact that such links may exist does not indicate approval or endorsement of any material contained on any linked site.
IC Markets is not liable for any harm caused by the transmission, through accessing the services or information on this site, of a computer virus, or other computer code or programming device that might be used to access, delete, damage, disable, disrupt or otherwise impede in any manner, the operation of the site or of any user’s software, hardware, data or property.


