A note on lower timeframe confirming price action…
Waiting for lower timeframe confirmation is our main tool to confirm strength within higher timeframe zones, and has really been the key to our trading success. It takes a little time to understand the subtle nuances, however, as each trade is never the same, but once you master the rhythm so to speak, you will be saved from countless unnecessary losing trades. The following is a list of what we look for:
- A break/retest of supply or demand dependent on which way you’re trading.
- A trendline break/retest.
- Buying/selling tails/wicks – essentially we look for a cluster of very obvious spikes off of lower timeframe support and resistance levels within the higher timeframe zone.
- Candlestick patterns. We tend to only stick with pin bars and engulfing bars as these have proven to be the most effective.
We search for lower timeframe confirmation between the M15 and H1 timeframes, since most of our higher-timeframe areas begin with the H4. Stops are usually placed 5-10 pips beyond confirming structures.
EUR/USD:
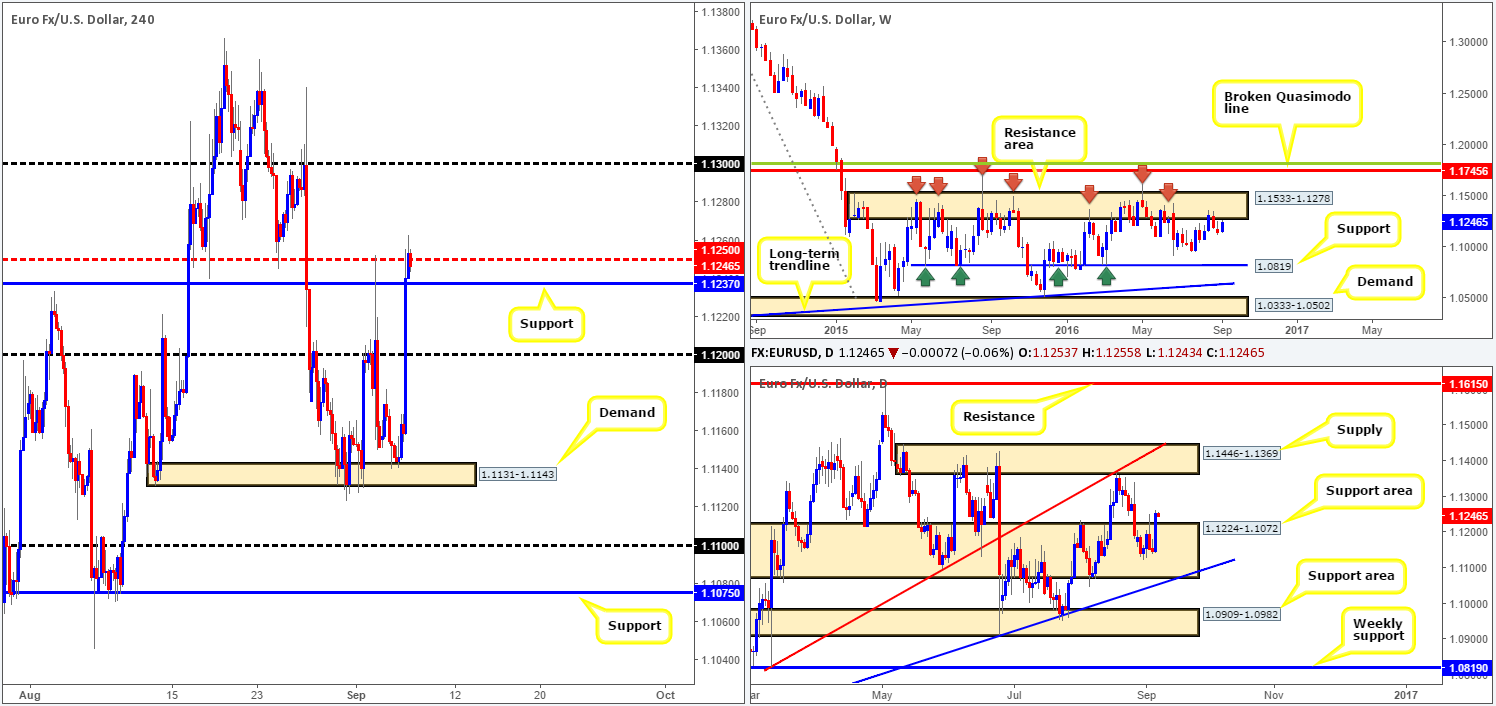
The single currency employed a more subtle approach yesterday, ranging a mere 43 pips on the day! The H4 mid-way resistance 1.1250 proved to be a troublesome barrier to break as price failed to sustain gains beyond this point. Going into yesterday’s London close, a two-candle (H4) whipsaw was seen through a nearby H4 support at 1.1237, which for the time being appears to be holding firm.
While the current H4 support seems to be secure, it may be worth noting that going into yesterday’s US open the EUR spiked to highs of 1.1271, missing the underside of the major weekly resistance area seen at 1.1533-1.1278 by 7 pips! Conversely, strengthening the pair, we can see that there is a daily support area penciled in at 1.1224-1.1072.
Our suggestions: As you can see, the higher-timeframe structures are not mixing too well at the moment. When this happens we tend to only hunt for small intraday moves backed by lower timeframe confirmation (see the top of this report). With this in mind, here’s what we have jotted down so far:
- Look for a decisive close above 1.1250 today. As long as price retests this barrier followed by a lower timeframe buy signal, a long entry is valid in our opinion, and has a high probability of achieving 1.13.
- Should the EUR plunge below the current H4 support line, there’s room seen for an intraday short down to the 1.12 handle. We would, nevertheless, require price to retest the underside of the broken H4 support and chalk up some form of a lower timeframe confirming sell signal before pulling the trigger here.
On the data front, investors look forward to the ECB press conference scheduled to begin at 1.30pm GMT, along with the US unemployment claims, also scheduled to be released at 1.30pm.
Levels to watch/live orders:
- Buys: Watch for price to close above 1.1250 and then look to trade any retest seen thereafter (lower timeframe confirmation required).
- Sells: Watch for price to close below the H4 support at 1.1237 and then look to trade any retest seen thereafter (lower timeframe confirmation required).
GBP/USD:
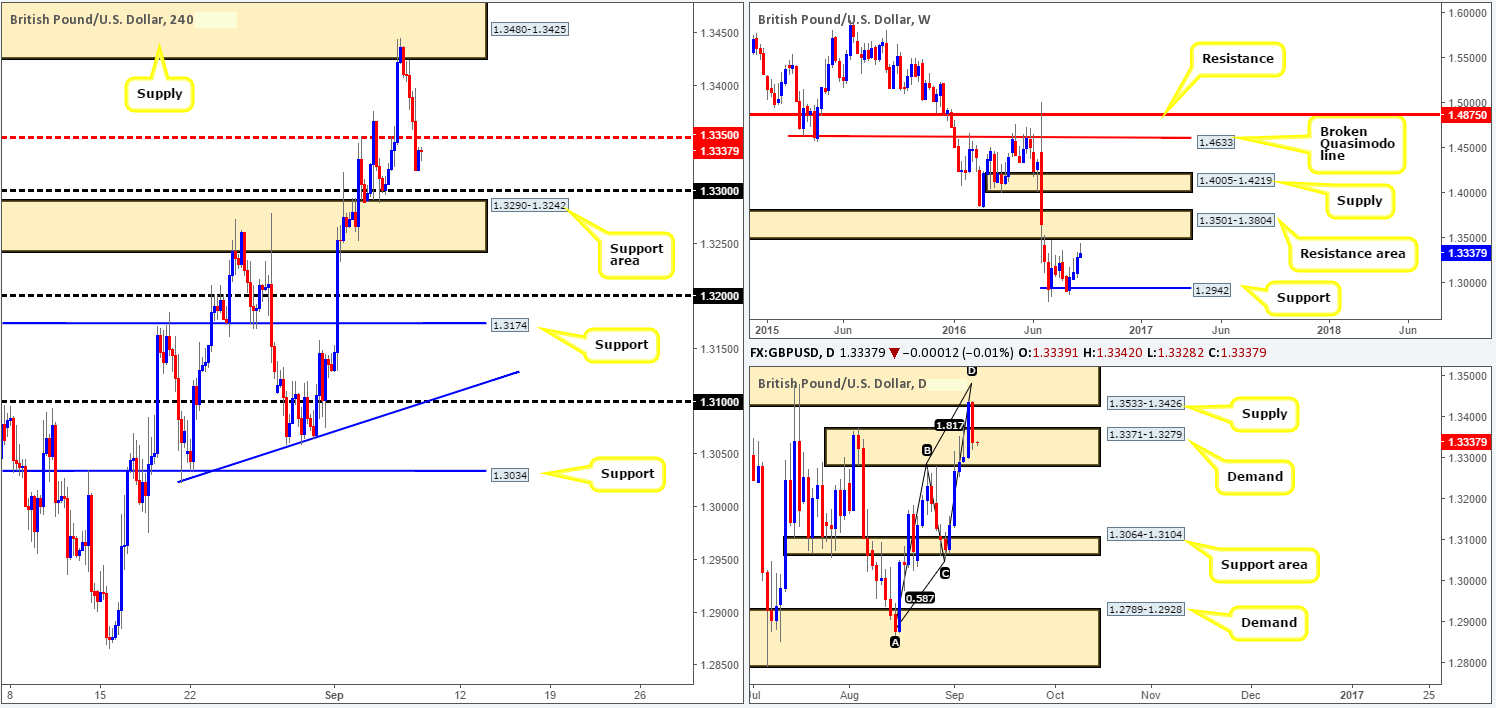
Yesterday’s UK factory production data came in lower than expected, consequently pushing the GBP into further losses from the H4 supply zone coming in at 1.3480-1.3425. A few hours later, it can be seen that candle action took a brief pause to make sense of the BoE’s Inflation Report Hearings, which ended with further downside being seen. The H4 mid-level support 1.3350 was taken out during this bearish onslaught, with the market closing the day just ahead of the 1.33 handle (bolstered by a H4 support area at 1.3290-1.3242).
Through the simple lens of a technical trader, this recent bout of selling did not likely come as too much of a surprise. At that time, daily price was trading within a supply zone seen at 1.3533-1.3426, which in itself is supported by a long-term weekly resistance area at 1.3501-1.3804.
Our suggestions: As is shown on the daily chart, cable is now seen hovering within a daily demand base drawn from 1.3371-1.3279, and as we already mentioned, H4 action is treading water above the 1.33 handle. Therefore, our team has noted that selling this market right now is out of the question.
Although price is now seen dancing within a daily demand base right now, buying this market is also just too risky for our liking given the recent sell off from a daily supply that’s supported by a long-term weekly resistance area. As far as we can see, technical elements are mixed at the moment leaving us with little choice but to remain flat for now.
Levels to watch/live orders:
- Buys: Flat (Stop loss: n/a).
- Sells: Flat (Stop loss: n/a).
AUD/USD:
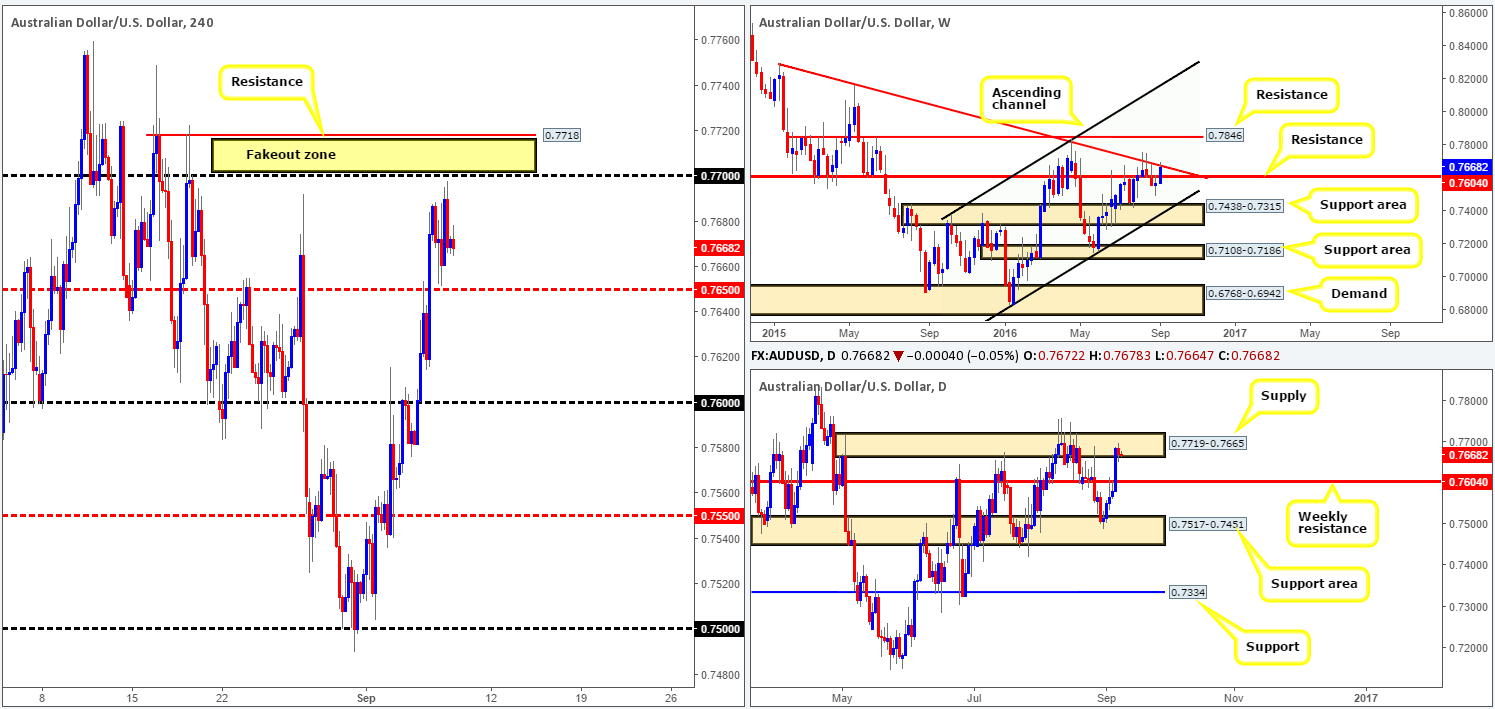
In a similar fashion to the EUR/USD, the Aussie pair had a rather quiet session yesterday, ranging only 46 pips on the day. As of now, we can see that price is currently loitering mid-range between the 0.76 handle and the H4 mid-way support 0.7650. Given the rather lackluster performance seen yesterday, we’ll be reemphasizing points made in our previous report…
With the H4 structure in mind, what’s the vibe like on the higher-timeframe picture? Weekly action shows price recently breached resistance coming in at 0.7604 and connected with trendline resistance extended from the high 0.8295. Looking down to the daily chart, however, supply at 0.7719-0.7665 remains strong, managing to hold price lower yesterday. This zone, as you can see, also held this market lower between the 10/18th August so there’s a chance that we may see history repeat itself here.
Our suggestions: Usually, our team would look to short 0.77 due to this number being positioned around both a daily supply as well as a weekly trendline resistance (see above). However, seeing as how there’s a nice-looking H4 resistance level at 0.7718 lurking just above it, we feel a fakeout is highly likely to take place. With that being the case, traders may want to keep an eye on this level for shorting opportunities today.
Be that as it may, in the next couple of hours the AUD trade balance is scheduled for release, which could cause technicals to take a back seat during this time, so remain vigilant!
Levels to watch/live orders:
- Buys: Flat (Stop loss: n/a).
- Sells: 0.7718 region [possible fakeout level] (Stop loss: around the 0.7752ish band).
USD/JPY:
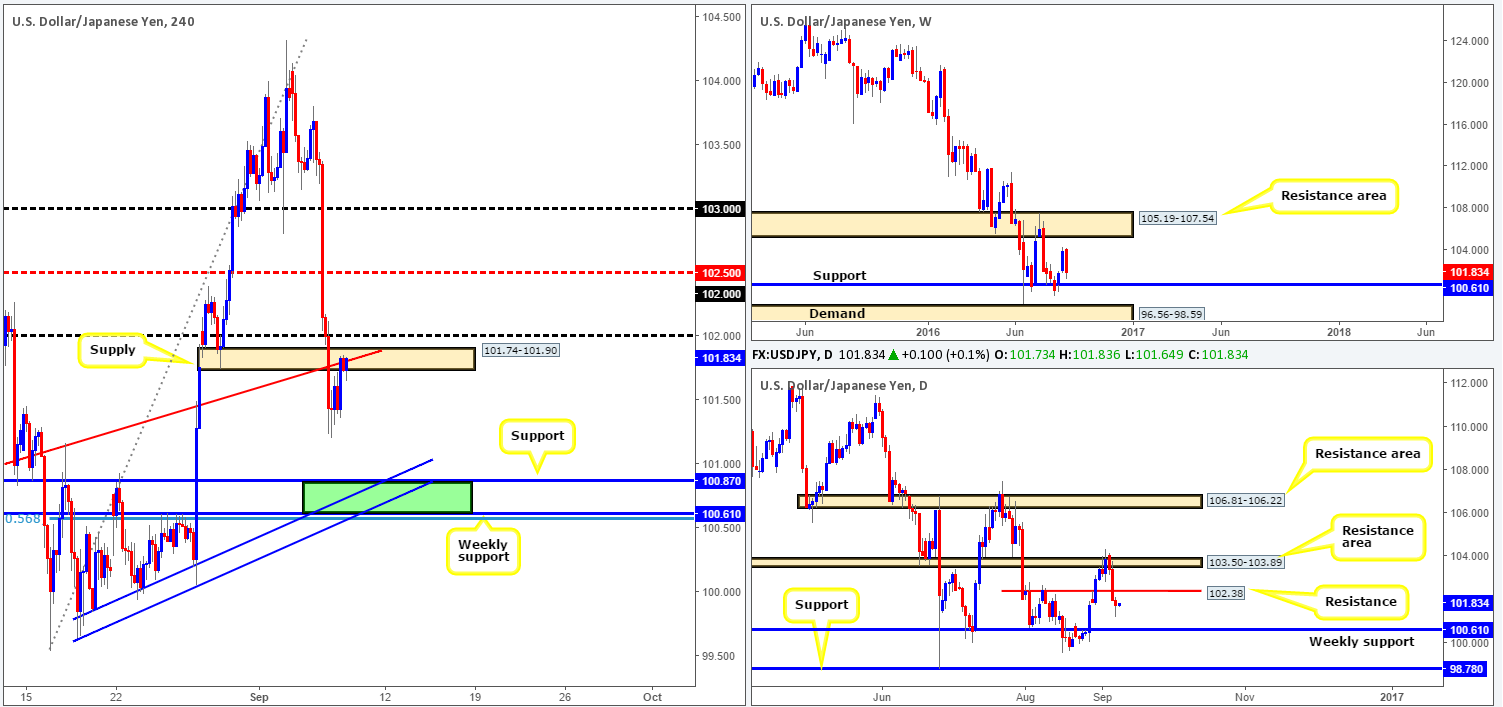
Following Tuesday’s sell off, H4 candle action closed below demand seen at 101.74-101.90, which is, as you can see, currently being retested as supply. In that this area also boasts a H4 trendline resistance extended from the low 99.98 as well as a nearby psychological resistance seen just above it at 102, a bearish rotation from this region is likely on the cards.
Given that H4 price is trading around a rather attractive sell zone, a certain harmony is being seen in this market. Both the weekly and daily charts show that there is little support standing in the way of a move lower down to weekly support coming in at 100.61.
Our suggestions: In view of the points made above, here’s what we’ve jotted down going forward:
- Watch for lower timeframe (confirmed – see the top of this report) sell entries into the market between the current H4 supply and round number 102 (confirmation is required to avoid any fakeout that may take place through the 102 hurdle, as these psychological boundaries tend to attract stop runs). Everything being equal, we expect prices to weaken from here down to at least the H4 support drawn from 100.87.
Should the above come to fruition, we would advise liquidating all short positions around the 100.87 band. The reason as to why is between this H4 support and the weekly support at 100.61, we have a strong-looking buy zone. Bolstered by a H4 trendline support taken from the low 99.64 as well as a H4 78.6% Fib support at 100.56, this area has enough confluence to buy from here without requiring the backing of lower timeframe confirmation.
On the data front guys, however, do keep an eyeball on the US unemployment claims report today at 1.30 pm GMT.
Levels to watch/live orders:
- Buys: 100.88 [pending order] (Stop loss: 100.48).
- Sells: 101.74-101.90 [tentative – confirmation required] (Stop loss: dependent on where one confirms this area).
USD/CAD:
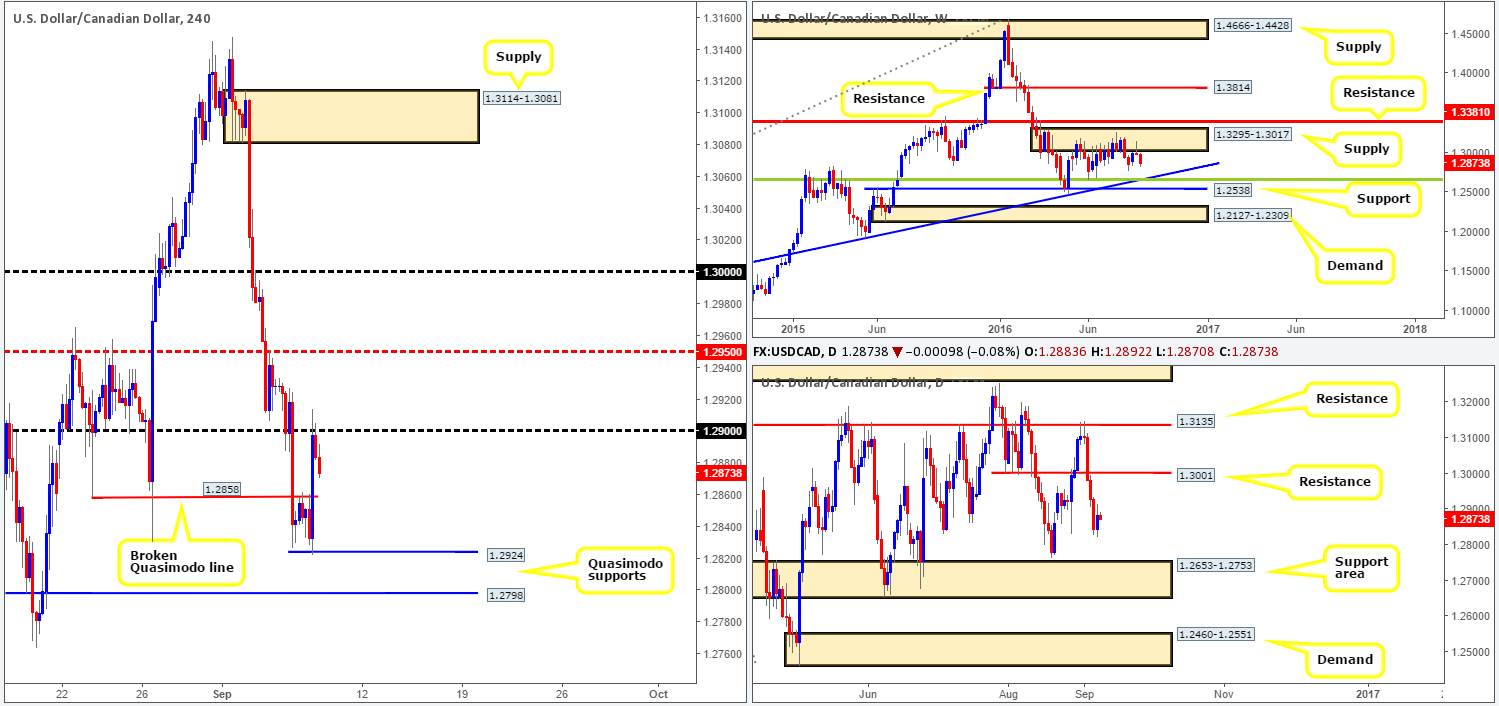
Despite the USD/CAD finding resistance around the H4 broken Quasimodo line at 1.2858 early on yesterday, the pair saw a sharp increase in value going into the US session after the BoC announced that it will be leaving the target rate at 0.5%. It was only once price collided with the 1.29 handle did we see things begin to settle down.
Looking over to the bigger picture, we can see the loonie continues to trade in the red following a pin-bar reaction off the weekly supply at 1.3295-1.3017. The next downside target seen from this angle comes in at 1.2658: a 38.2% Fib support. Down on the daily chart, daily price looks set to continue lower down to the support area at 1.2653-1.2753 (encapsulates the above said weekly Fib level).
Our suggestions: It’s likely we’ll see the pair continue to grind south today at least until price shakes hands with the H4 Quasimodo support at 1.2924. However, should the unit retrace prior to hitting this Quasimodo, and recheck the 1.29 band, our team would, given the higher-timeframe picture, look to short this level on the basis of a H4 bearish close. In the event that this comes to fruition, 1.2924 would, of course, be our first take-profit target, followed by another H4 Quasimodo support at 1.2798 and then finally the H4 mid-way support 1.2750 (which happens to represent the top edge of the current daily support area).
Levels to watch/live orders
- Buys: Flat (Stop loss: n/a).
- Sells: 1.29 region [tentative – H4 bearish close required] (Stop loss: beyond the trigger candle).
USD/CHF:
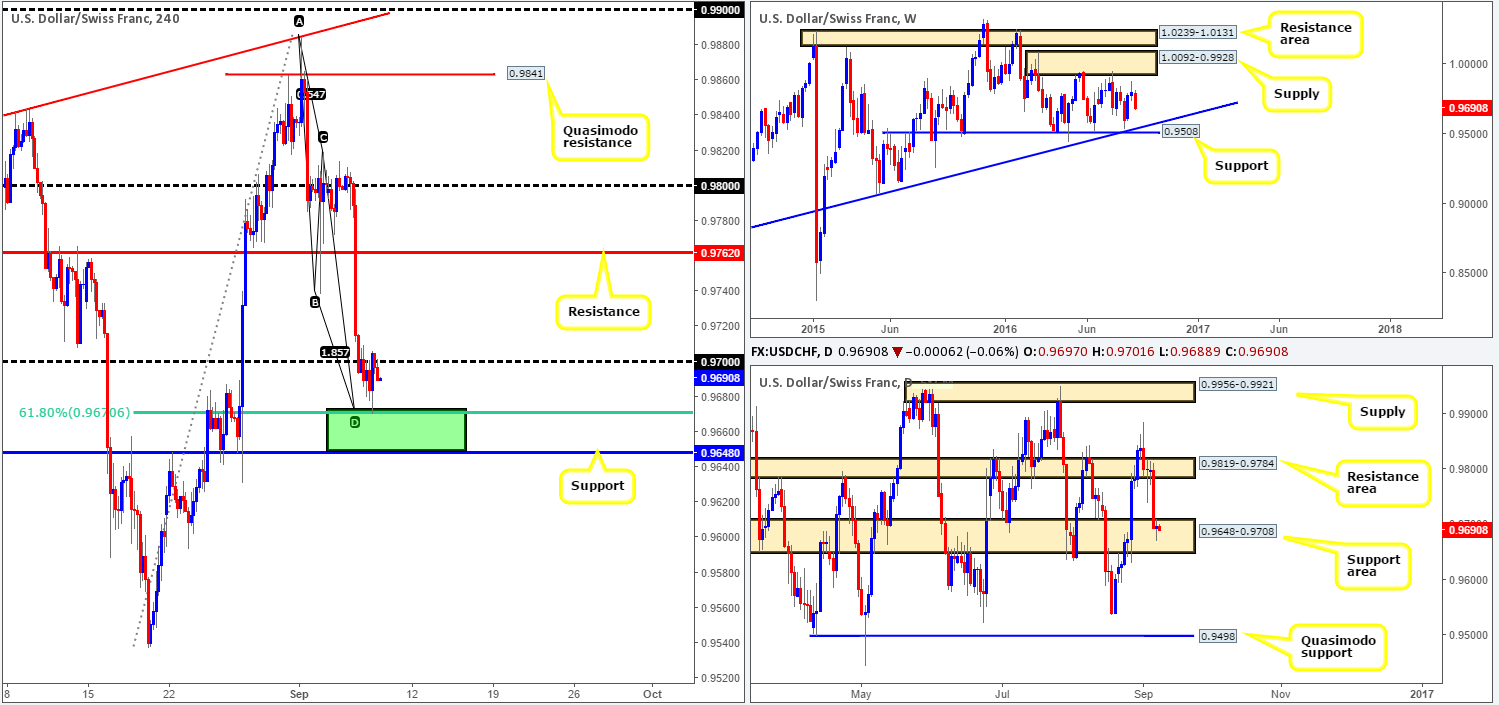
For those who read our previous report on the Swissy pair you may recall us highlighting the 0.9648/0.9673 region as a nice-looking H4 buy zone. Housed within a daily support area drawn from 0.9648-0.9708, this H4 buy zone comprises of a H4 support level at 0.9648, a H4 AB=CD completion point checking in at 0.9673 and a H4 61.8% Fib support at 0.9670. As is shown on the H4 chart, price bounced beautifully from the top edge of our buy zone going into the yesterday’s US session. Well done to any of our readers who managed to pin down a position from here. To further confirm upside from this area, nevertheless, a decisive close above 0.97 would need to be seen.
Our suggestions: As mentioned in our previous analysis, we were looking for price to reach at least 0.97. This is where we would have taken 50% off the table and likely reduced risk to breakeven. Furthermore, we did also mention to be extra careful here as weekly action shows room to extend down to the 0.9508 (support) hurdle.
If a push higher is seen today, however, and the 0.97 line is taken out, we would then also be looking to trade any confirmed (see the top of this report) retest of this number, targeting the H4 resistance at 0.9762 as our first take-profit zone.
Levels to watch/live orders:
- Buys: Watch for price to close above the 0.97 handle and then look to trade any retest seen thereafter (lower timeframe confirmation required).
- Sells: Flat (Stop loss: n/a).
DOW 30:
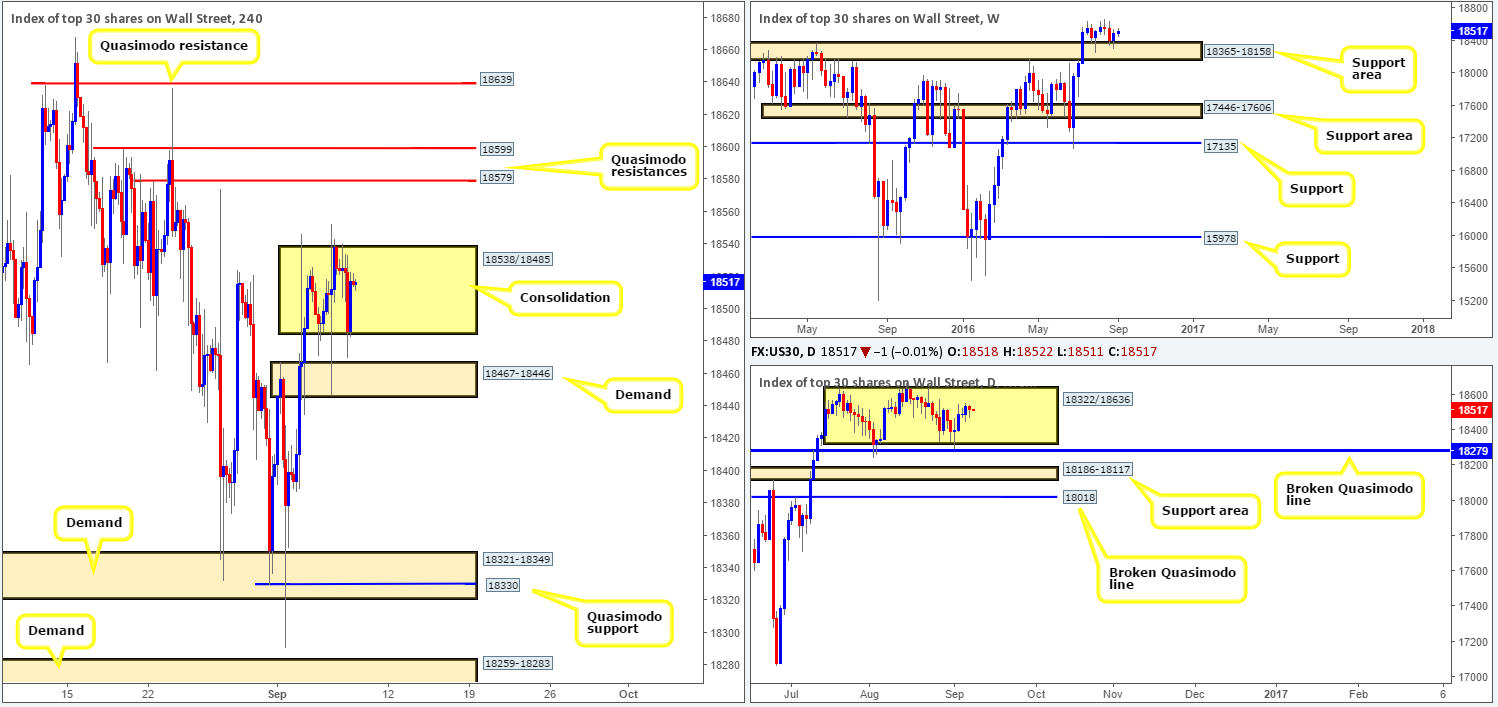
Since the beginning of the week, the DJIA H4 chart has been carving out a consolidation zone fixed between 18538/18485. Directly below this range sits a H4 demand base coming in at 18467-18446, while above it we can see a pair of H4 Quasimodo resistances coming in at 18599/18579.
Over on the weekly chart on the other hand, price recently rebounded off the top edge of a support area coming in at 18365-18158, which could support an advance up to (and possibly beyond) the all-time high 18668 this week. Looking down to the daily chart, we can see that the DOW remains trading mid-range between 18322/18636. This, along with weekly action, will likely see the index attack the top-side of this range sometime this week, and with a little bit of luck, possibly close above it.
Our suggestions: On account of where price is positioned on the weekly chart right now (see above), we feel a close above the current H4 range is likely to take place. Followed by a retest and a H4 bullish close, our team has noted that they would enter long from here, targeting the pair of aforementioned H4 Quasimodo resistances as an immediate take-profit area. If this comes to fruition, we would personally look at holding some of this position beyond this target, since, as we already mentioned, there’s potential for this market to break all-time highs and continue trading north. However, do keep a tab on the US employment claims report today, which is set to be released at 1.30pm GMT, as technicals may take a back seat during this time!
Levels to watch/live orders:
- Buys: Watch for price to close above the 18538 level and then look to trade any retest seen thereafter (H4 bullish close required prior to pulling the trigger).
- Sells: Flat (Stop loss: n/a).
GOLD:
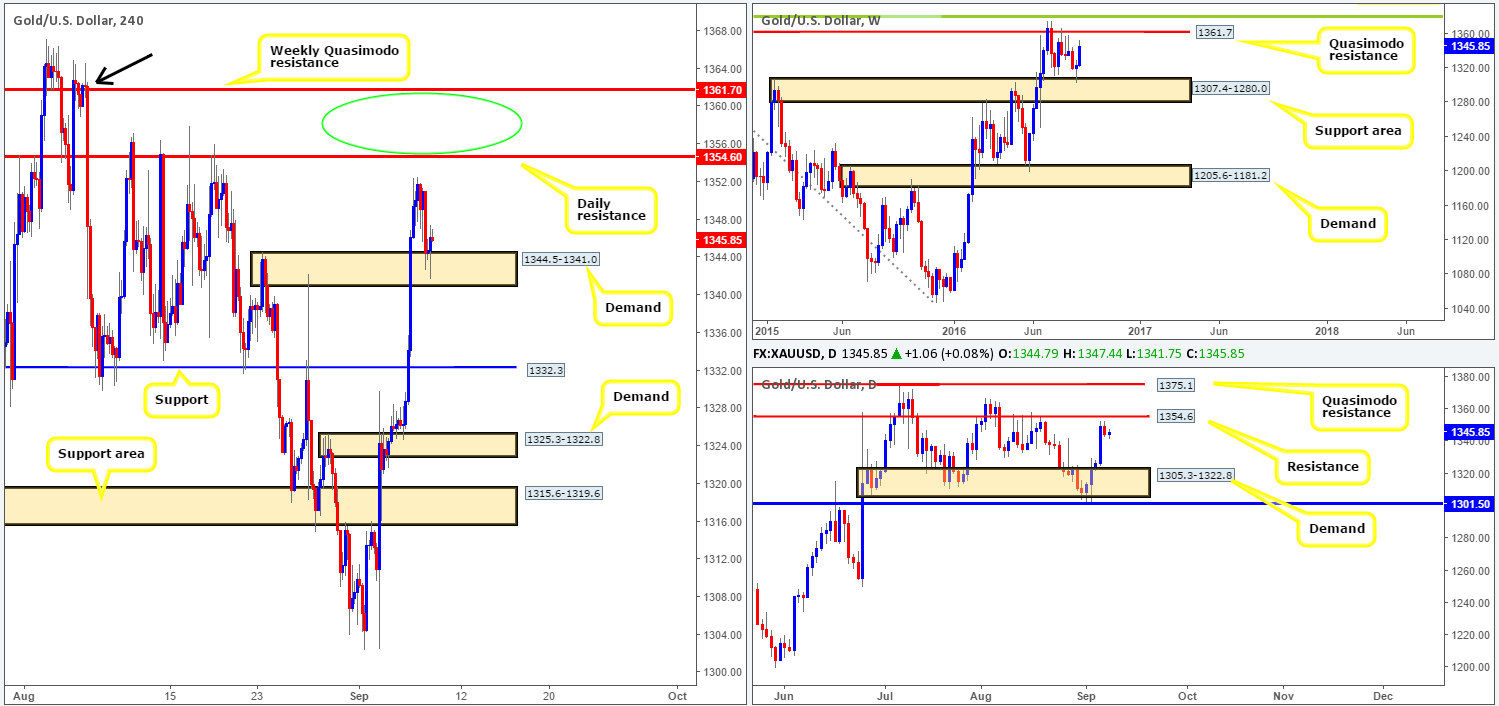
Beginning with a look at the weekly chart this morning, it’s reasonably clear to see that the yellow metal is trading within shouting distance of a Quasimodo resistance level drawn from 1361.7. At this point, it’s difficult to judge whether or not price will actually reach this line this week due to a daily resistance level seen just below it coming in at 1354.6. Stepping across to the H4 chart, the price of gold topped out around the 1351.7ish range yesterday and collapsed down to a H4 demand base seen at 1344.5-1341.0, which for the time being is holding firm. With a reasonable H4 bullish close recently printed from this zone, we see no reason not to attempt to trade long from here (stops below trigger candle), targeting the above said daily resistance level.
Should price reach the daily resistance level, our team will look to close out any buys we have in this market, and then switch our attention to hunting for shorts between 1361.7/1354.6 (weekly Quasimodo level/daily resistance level – green circle). Seeing as how this area is rather large, we will not be placing pending orders here. Waiting for the lower timeframes (preferably the M30/H1 timeframes) to confirm bearish intent here is, at least in our book, the better route to take (see the top of this report for lower timeframe entry techniques). This will not only likely get you in at a better price, but also lessen the stop loss required since we’d be looking to place it above the H4 supply seen marked with a black arrow at 1364.9-1360.5.
Levels to watch/live orders:
- Buys: 1345.9 [live] (Stop loss: 1340.5).
- Sells: 1361.7/1354.6 [tentative – confirmation required] (Stop loss: dependent on where one confirms this area).
