Waiting for lower timeframe confirmation is our main tool to confirm strength within higher timeframe zones, and has really been the key to our trading success. It takes a little time to understand the subtle nuances, however, as each trade is never the same, but once you master the rhythm so to speak, you will be saved from countless unnecessary losing trades. The following is a list of what we look for:
- A break/retest of supply or demand dependent on which way you’re trading.
- A trendline break/retest.
- Buying/selling tails/wicks – essentially we look for a cluster of very obvious spikes off of lower timeframe support and resistance levels within the higher timeframe zone.
We typically search for lower-timeframe confirmation between the M15 and H1 timeframes, since most of our higher-timeframe areas begin with the H4. Stops are usually placed 1-3 pips beyond confirming structures.
EUR/USD:
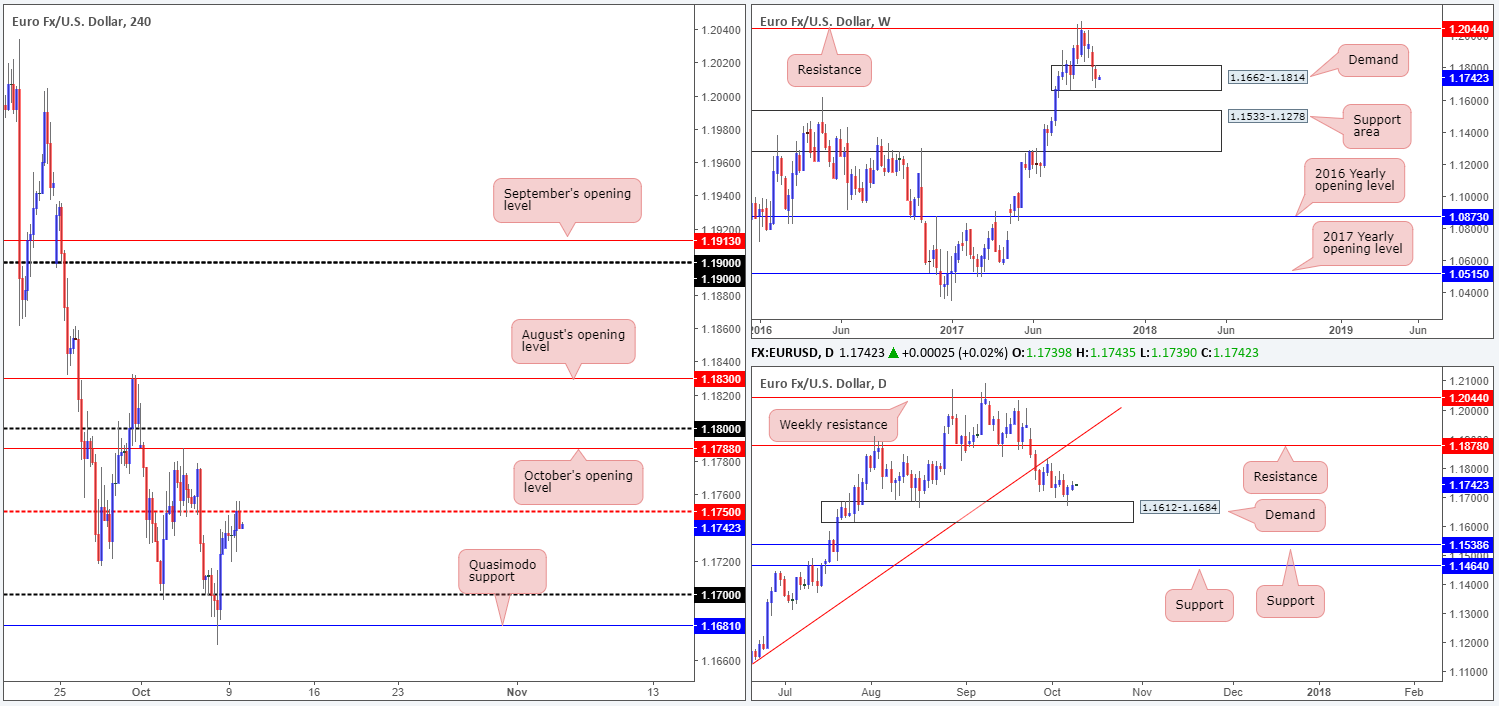
Recent trading shows that the single currency marginally extended Friday’s correction, consequently pulling H4 price up to the mid-level resistance at 1.1750 which, as you can see, held firm into the closing bell. Considering that weekly action remains trading within the walls of a demand at 1.1662-1.1814, and daily price recently tapped the top edge of a demand area coming in at 1.1612-1.1684, 1.1750, we believe, will likely eventually give way.
Suggestions: On the grounds that price is seen trading from higher-timeframe demands, looking for longs above 1.1750 could be an option today. Once/if price crosses beyond this hurdle, October’s opening level at 1.1788/1.18 handle, followed closely by August’s opening level at 1.1830 will be the next upside targets in the spotlight.
Data points to consider: FOMC member Kashkari speaks at 3pm GMT+1.
Levels to watch/live orders:
- Buys: Watch for H4 price to engulf 1.1750 and then look to trade any retest seen thereafter ([waiting for a lower-timeframe confirming signal to form following the retest is advised – see the top of this report] stop loss: dependent on where one confirms this level).
- Sells: Flat (stop loss: N/A).
GBP/USD:
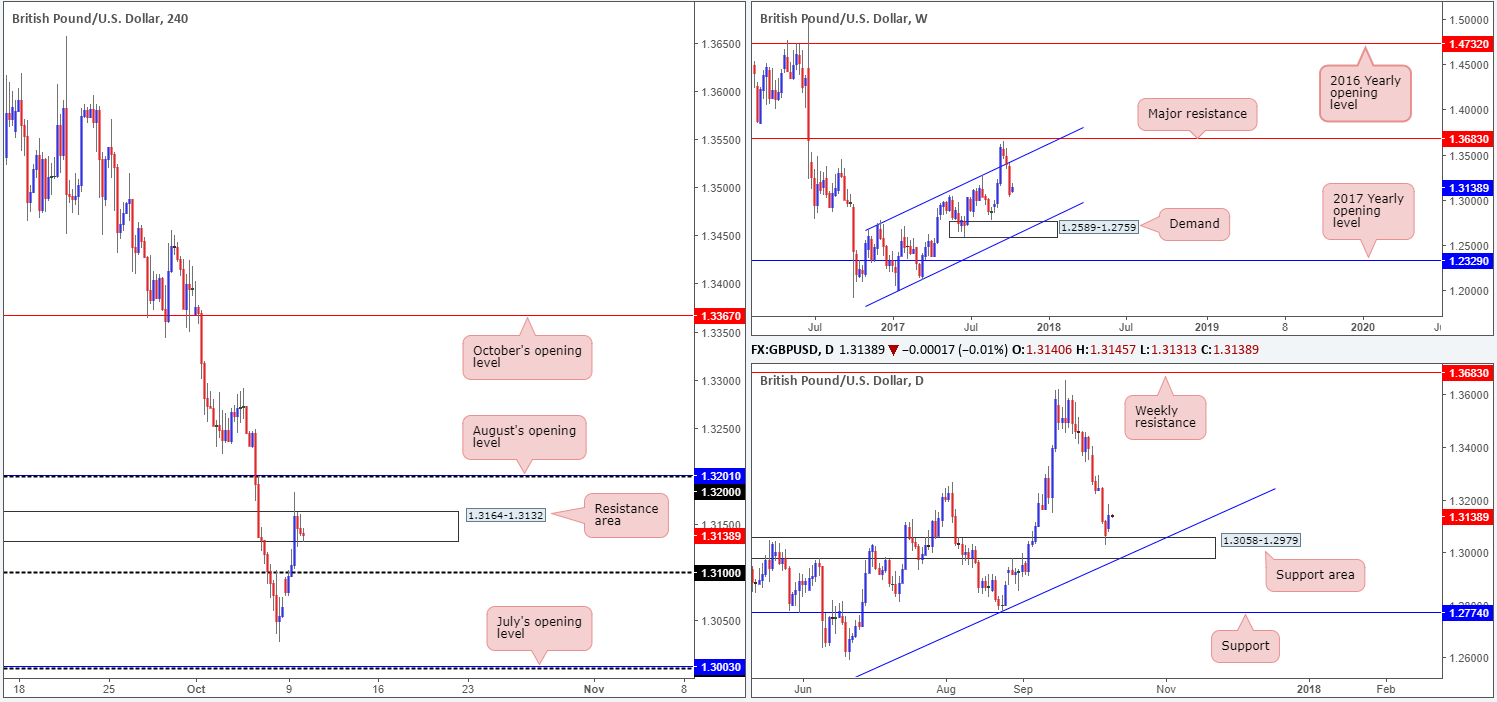
Leaving the weekend gap unfilled, the British pound rallied against its US counterpart on Monday, taking out the nearby 1.31 handle and later whipsawing through the top edge of a H4 resistance area marked at 1.3164-1.3132. The move, in our technical opinion, was bolstered by the current daily support area seen at 1.3058-1.2979. However, given the recent selling we’ve seen in this market, we don’t believe that this upside move is sustainable. In addition to this, weekly price recently re-entered an ascending channel formation (1.1986/1.2673), potentially opening up downside to as low as the demand area positioned at 1.2589-1.2759, which happens to merge with the noted channel support.
Suggestions: Near-term bias is tilted to the downside for now, in our view. The whipsaw above the current H4 resistance area has likely filled a boatload of stops, providing liquidity for bigger traders to sell and potentially bring the unit down to at least 1.31. This, at least for us, however, is not something we would be interested in trading. There’s just not enough technical confluence.
As such, the team has concluded that remaining on the sidelines may be the better path to take today.
Data points to consider: UK manufacturing production m/m and goods trade balance at 9.30am; FOMC member Kashkari speaks at 3pm GMT+1.
Levels to watch/live orders:
- Buys: Flat (stop loss: N/A).
- Sells: Flat (stop loss: N/A).
AUD/USD:
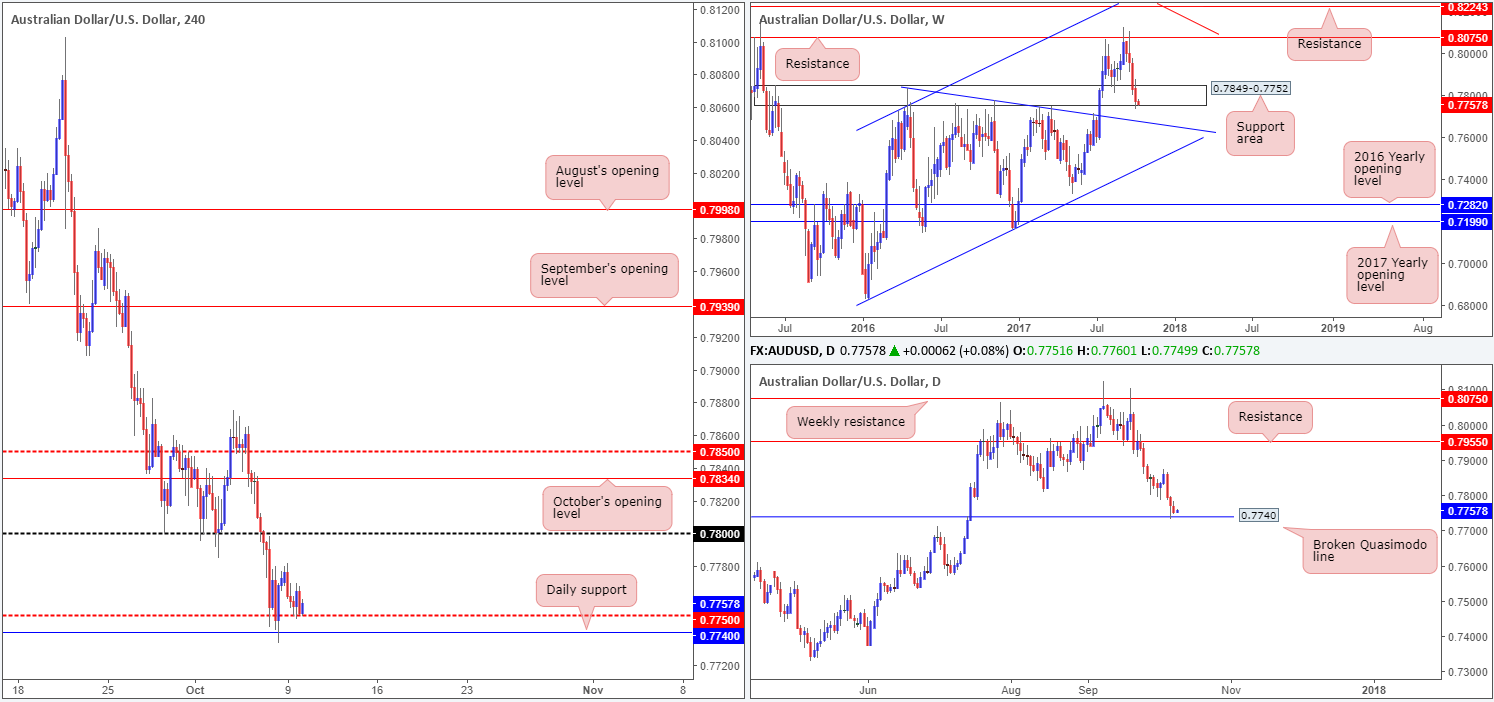
Kicking this morning’s report off with a quick look at the weekly timeframe, we can see that price is attempting to tunnel its way through the lower edge of a support area fixed at 0.7849-0.7752. A continued push to the downside from here would highly likely see the unit challenge nearby trendline support extended from the high 0.7835. Before the weekly sellers can accomplish this, however, the broken Quasimodo level at 0.7740 seen on the daily timeframe will need to be consumed.
As can be seen on the H4 timeframe this morning, price failed to print anything of note during Monday’s segment. The commodity currency remains bid above the mid-level support at 0.7750 at the moment and, as far as we can see, there’s little active supply overhead until we reach the 0.78 handle.
Suggestions: In view of weekly price, entering long in this market is tricky, despite both H4 and daily price trading from support at the moment. With this in mind, it would be, at best, a guess trade given the conflicting higher-timeframe signals. For that reason, opting to stand on the sidelines today may be the better route to take.
Data points to consider: NAB business confidence at 1.30am; RBA Assist Gov. Debelle speech at 4.20am; FOMC member Kashkari speaks at 3pm GMT+1.
Levels to watch/live orders:
- Buys: Flat (stop loss: N/A).
- Sells: Flat (stop loss: N/A).
USD/JPY:
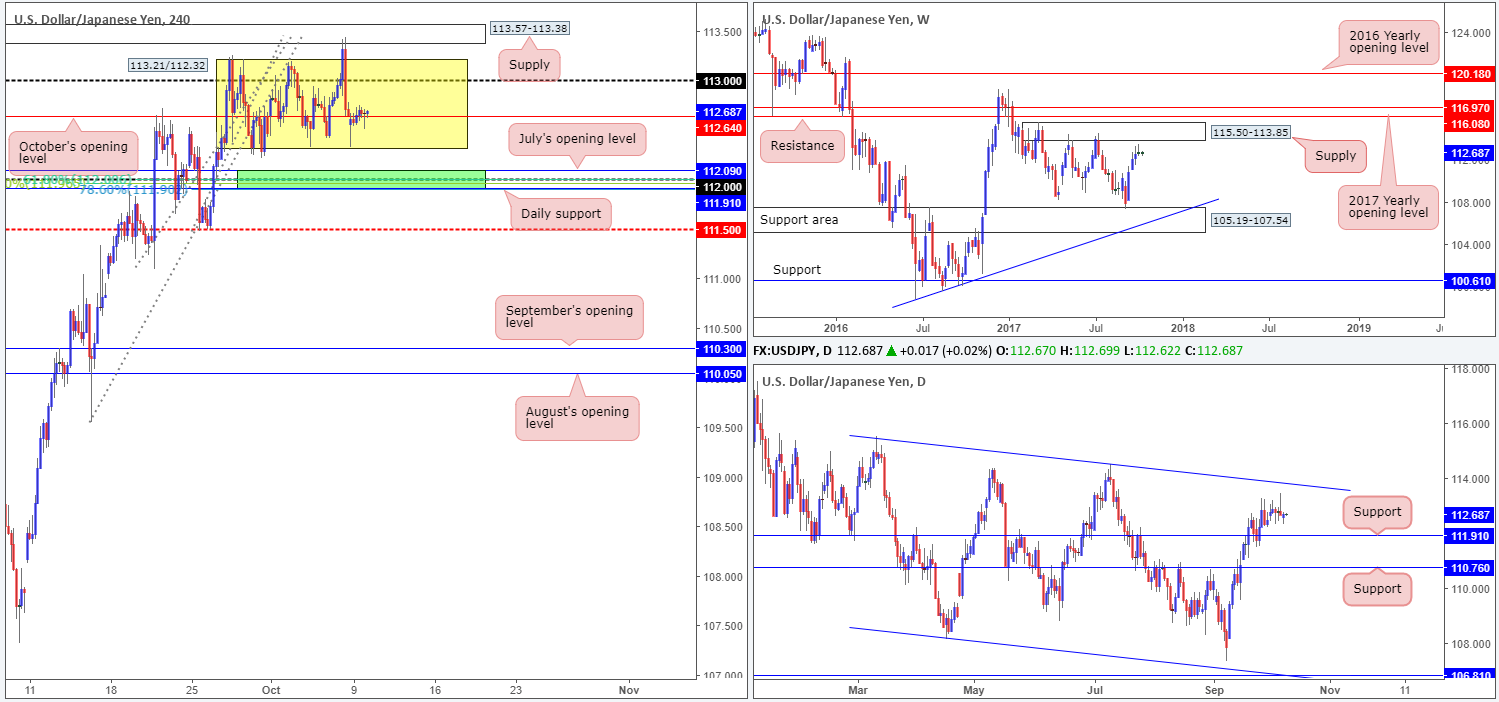
As expected, it was a quiet Monday given both US and Japanese banks were closed. H4 price spent the day trading in a confined range around October’s opening level at 112.64, after tapping a session low of 112.33 in early trade. Due to yesterday’s lackluster performance, much of the following report will echo thoughts put forward in Monday’s analysis…
The weekly candles appear somewhat exhausted ahead of weekly supply coming in at 115.50-113.85. Although we believe dollar bulls will still likely challenge the noted supply, the back-to-back weekly selling wicks may encourage sellers into the market this week. In conjunction with weekly flow, the picture on the daily timeframe also reveals space for the bulls to push north this week up to the trendline resistance extended from the high 115.50 (merges nicely with the noted weekly supply). With that being said though, Friday’s bearish selling wick looks somewhat threatening and therefore could still force price back down to retest support at 111.91.
Suggestions: The 112 handle remains in the spotlight. For those of you who follow our reports on a regular basis you may recall we have been banging the drum about 112 for a while now. Here’s why:
- Positioned directly above daily support at 111.91.
- Located just below July’s opening level at 112.09.
- Sited nearby a Fibonacci cluster comprised of a 38.2% support at 111.96 taken from the low 109.54, a 61.8% support at 112 from the low 111.09 and a 78.6% support at 111.90 drawn from the low 111.47.
- The stop-loss orders planted below the range edge at 112.32 (see yellow box). When these stops are triggered they, along with breakout sellers’ orders, become sell orders and thus help provide traders with deep pockets the liquidity required to buy.
Suggestions: With space seen for both weekly and daily action to push higher, coupled with the 112 handle’s surrounding confluence mentioned above, a long from the green H4 buy zone is worthy of attention. As psychological levels are prone to fakeouts, however, you may want to wait for H4 price to confirm buyer intent before pulling the trigger. For us, this would simply be a full or near-full-bodied bullish candle seen within the green zone, which would, in our view, provide enough evidence to hold the position up to at least October’s opening level at 112.64/113 handle.
Data points to consider: FOMC member Kashkari speaks at 3pm GMT+1.
Levels to watch/live orders:
- Buys: 111.91/112.09 ([waiting for a reasonably sized H4 bullish candle to form – preferably a full, or near-full-bodied candle – is advised] stop loss: ideally beyond the candle’s tail).
- Sells: Flat (stop loss: N/A).
USD/CAD:
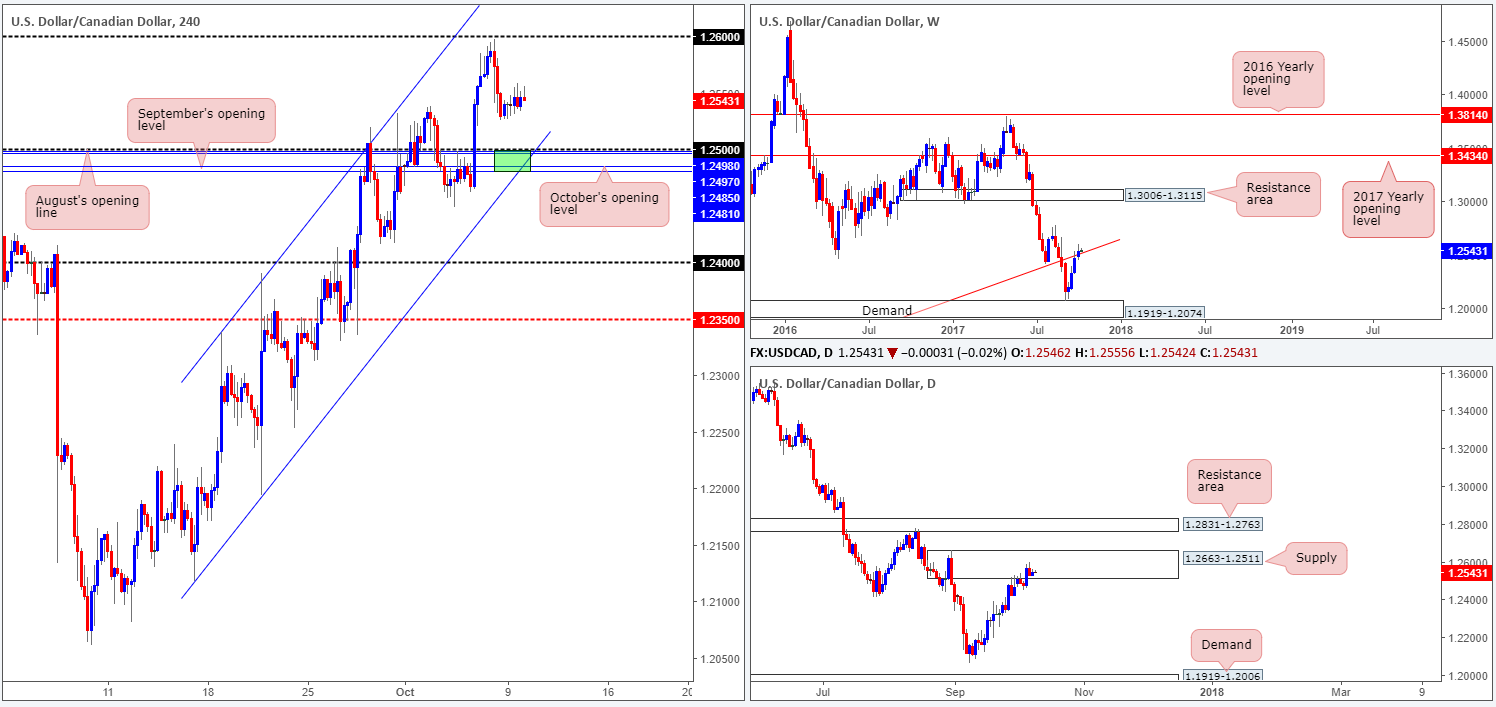
Trading volume was thin on Monday as both US and Canadian banks were closed. H4 price, as you can see, traded within a narrow 30-pip band (1.2558/1.2526). Against this background, much of the following analysis will follow a similar path to Monday’s outlook…
Last week’s trade showed that weekly flow marginally close above a trendline resistance taken from the low 0.9633. Despite this, the daily candles, as you can see, remain fixed within a strong-looking supply at 1.2663-1.2511.
1.25 has the potential to bounce price, in our humble opinion. Not only does the level converge with a H4 channel support etched from the low 1.2194, it also boasts August (1.2498), September (1.2481) and October’s (1.2485) monthly opening levels (see H4 green zone). Why we believe these supports will only bounce price is simply due to where the candles are trading on the bigger picture (see above), along with the strong downtrend this market is in at the moment.
Suggestions: Assuming that your trading plan agrees with the noted outlook, we would strongly advise waiting for at least a reasonably sized H4 bull candle to take shape from 1.25, preferably in the form of a full or near-full-bodied candle, before pulling the trigger. This will, of course, not guarantee a successful trade given the position of price on the higher timeframes, but what it will do is show buyer intent around a high-probability buy zone.
Data points to consider: FOMC member Kashkari speaks at 3pm; CAD Building permits m/m at 1.30pm; Gov. Council member Wilkins speech at 7pm GMT+1.
Levels to watch/live orders:
- Buys: 1.25 region ([waiting for a reasonably sized H4 bullish candle to form – preferably a full, or near-full-bodied candle – is advised] stop loss: ideally beyond the candle’s tail).
- Sells: Flat (stop loss: N/A).
USD/CHF:
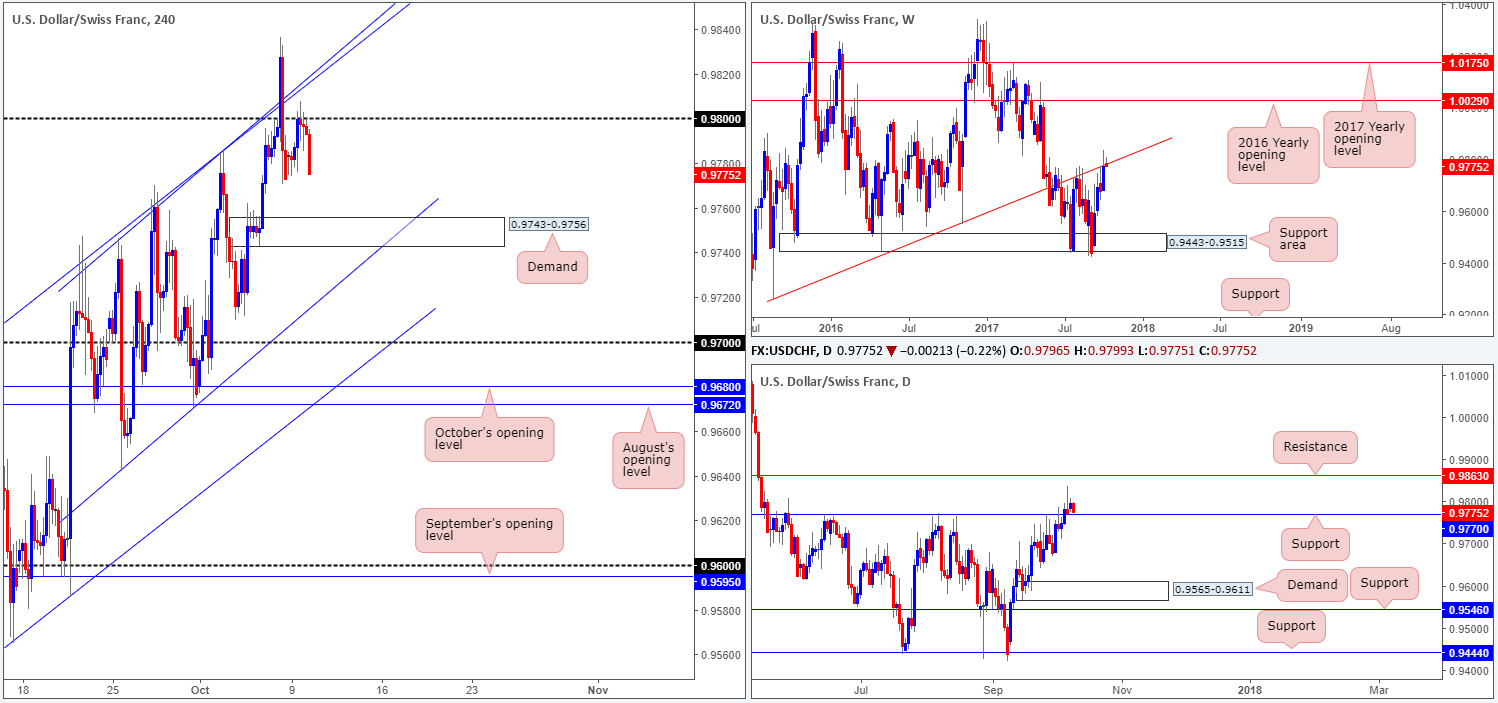
US markets were closed due to an official holiday on Monday, consequently causing trading volume to thin out. The pair did, however, move enough to retest the underside of the 0.98 handle, which has done a marvelous job in holding H4 price lower. Should the bears remain in the driving seat here, the next port of call, apart from Friday’s lows of 0.9770, will likely be the H4 demand base logged in at 0.9743-0.9756. Over on the daily timeframe, nearby support at 0.9770 will likely be brought into the picture today. If this level holds ground, this could place upward pressure on the weekly trendline resistance extended from the low 0.9257.
Suggestions: Unless you fancy your chances selling into the current daily support, trading short based on where weekly price is positioned at the moment is not something we’d stamp a high-probability trade. Buying from the nearby H4 demand, although a reasonably strong-looking zone, is also an awkward trade given that you’d effectively be buying into potential weekly sellers!
With the above notes in mind, remaining flat seems the only logical call, in our humble view.
Data points to consider: FOMC member Kashkari speaks at 3pm GMT+1.
Levels to watch/live orders:
- Buys: Flat (stop loss: N/A).
- Sells: Flat (stop loss: N/A).
DOW 30:
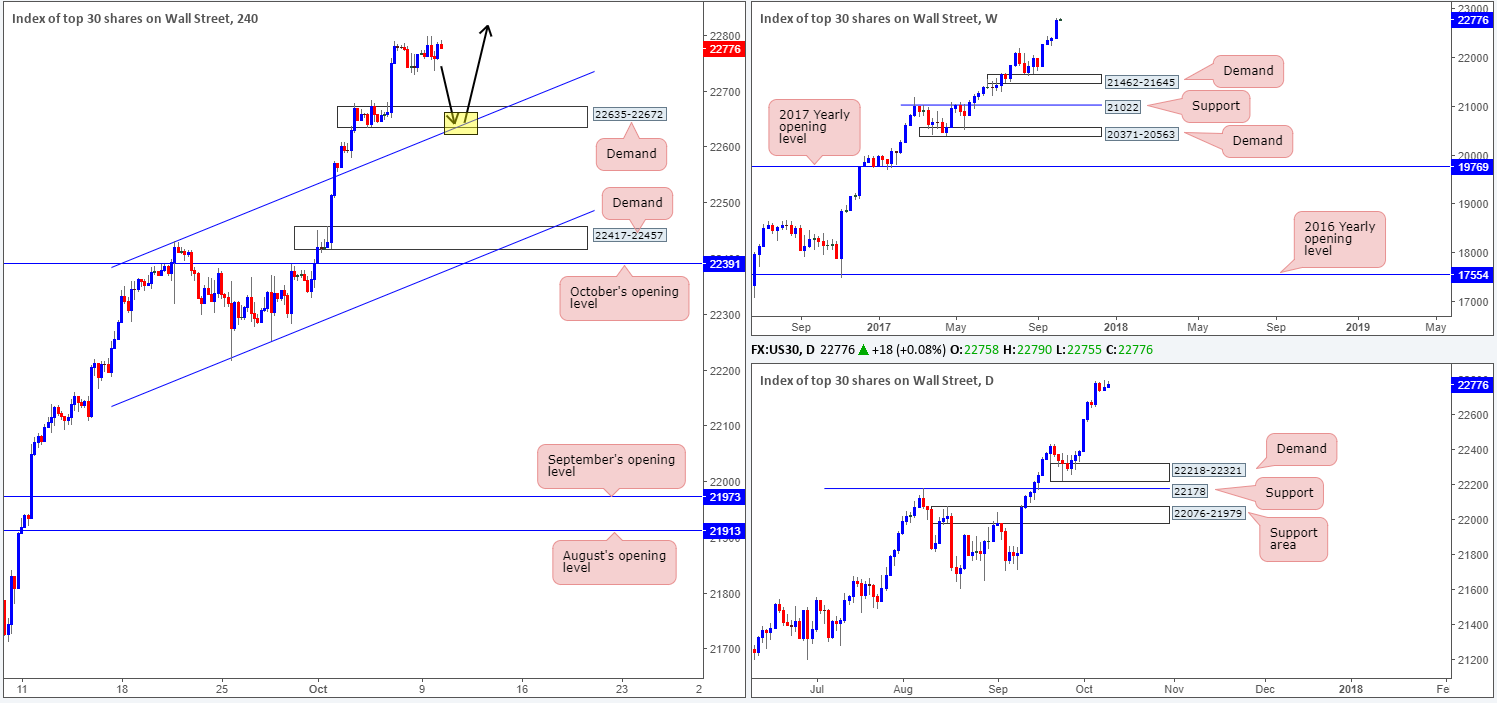
Trading volume was thin during yesterday’s segment due to the Columbus Day holiday in the US. The high for the day came in at 22799 and the session low was clocked at 22734 – a 65-point range.
Given yesterday’s lackluster performance, we still have our eye on the newly-formed H4 demand base at 22635-22672 for potential longs. Not only has this demand formed within an incredibly strong uptrend, it also fuses with a recently broken H4 channel resistance extended from the high 22431 (now acting support).
Suggestions: With the uptrend in this market clearly strong and intact, we’re now looking for H4 price to pullback and connect with the said H4 demand at the point where the H4 channel support converges (yellow marker). Should a reasonably sized H4 bull candle take shape from this area (preferably a full or near-full-bodied candle), we would have little hesitation in pulling the trigger here.
Data points to consider: FOMC member Kashkari speaks at 3pm GMT+1.
Levels to watch/live orders:
- Buys: Watch for H4 price to test the channel support/demand at 22635-22672 for a long ([waiting for a reasonably sized H4 bullish candle to form – preferably a full, or near-full-bodied candle – is advised] stop loss: ideally beyond the candle’s tail).
- Sells: Flat (stop loss: N/A).
GOLD:
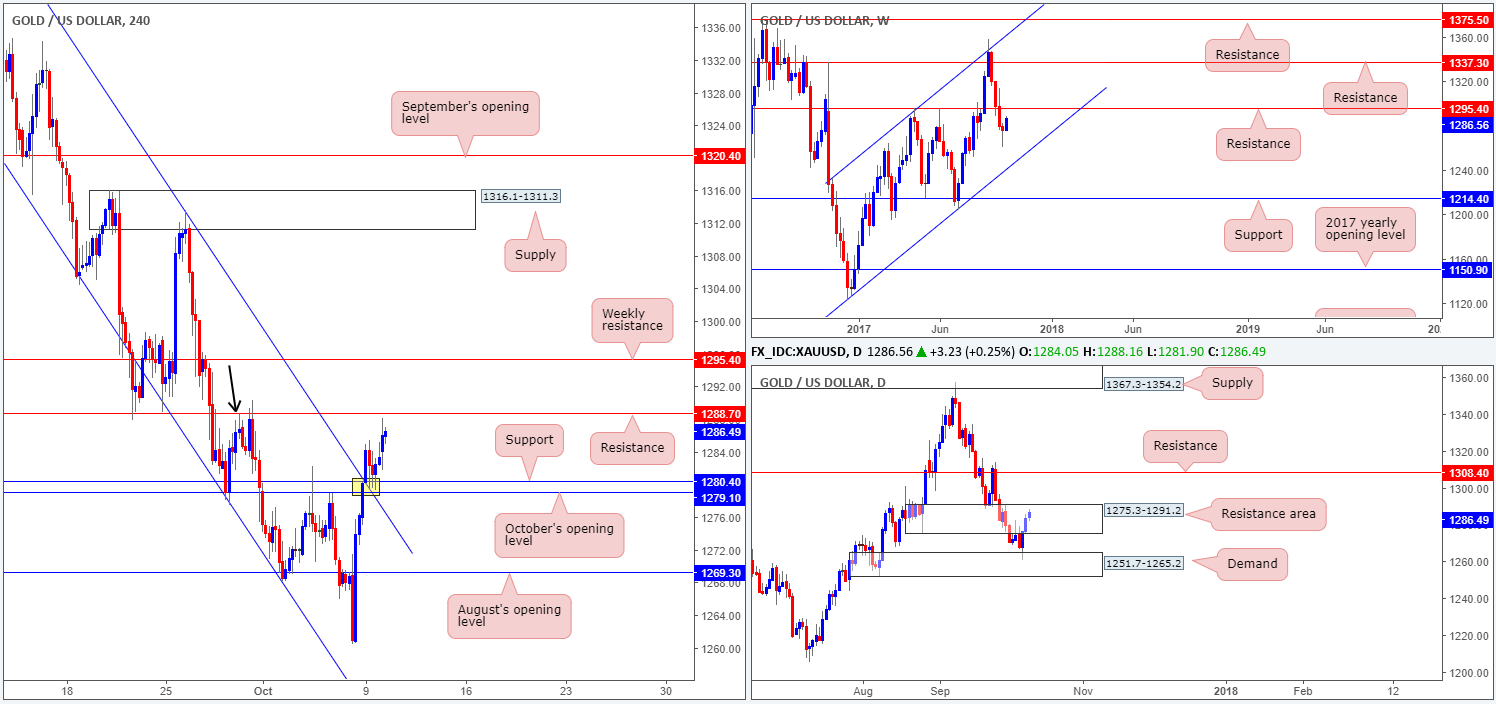
During the course of yesterday’s sessions, the yellow metal headed north and ran through the H4 channel resistance extended from the high 1357.5. Following a beautiful retest of this broken channel line as support, along with H4 support at 1280.4/October’s opening level at 1279.1, the unit is now seen lurking just ahead of H4 resistance picked at 1288.7 (also represents a H4 Quasimodo resistance – see black arrow). Thanks to this recent bout of buying, weekly price looks poised to shake hands with resistance coming in at 1295.4, and the daily candles are now seen trading within the upper limits of a resistance area at 1275.3-1291.2.
Suggestions: Although weekly action shows some room to advance higher, we do not anticipate gold trading much beyond the noted weekly resistance. In fact, this level, coupled with daily resistance at 1308.4 (seen above the current daily resistance area), would be an ideal location to hunt for shorts, in our technical view.
Levels to watch/live orders:
- Buys: Flat (stop loss: N/A).
- Sells: 1308.4/1295.4 region is an ideal zone to hunt for shorting opportunities.
