Waiting for lower timeframe confirmation is our main tool to confirm strength within higher timeframe zones, and has really been the key to our trading success. It takes a little time to understand the subtle nuances, however, as each trade is never the same, but once you master the rhythm so to speak, you will be saved from countless unnecessary losing trades. The following is a list of what we look for:
- A break/retest of supply or demand dependent on which way you’re trading.
- A trendline break/retest.
- Buying/selling tails/wicks – essentially we look for a cluster of very obvious spikes off of lower timeframe support and resistance levels within the higher timeframe zone.
- Candlestick patterns. We tend to stick with pin bars and engulfing bars as these have proven to be the most effective.
We typically search for lower-timeframe confirmation between the M15 and H1 timeframes, since most of our higher-timeframe areas begin with the H4. Stops are usually placed 3-5 pips beyond confirming structures.
EUR/USD:
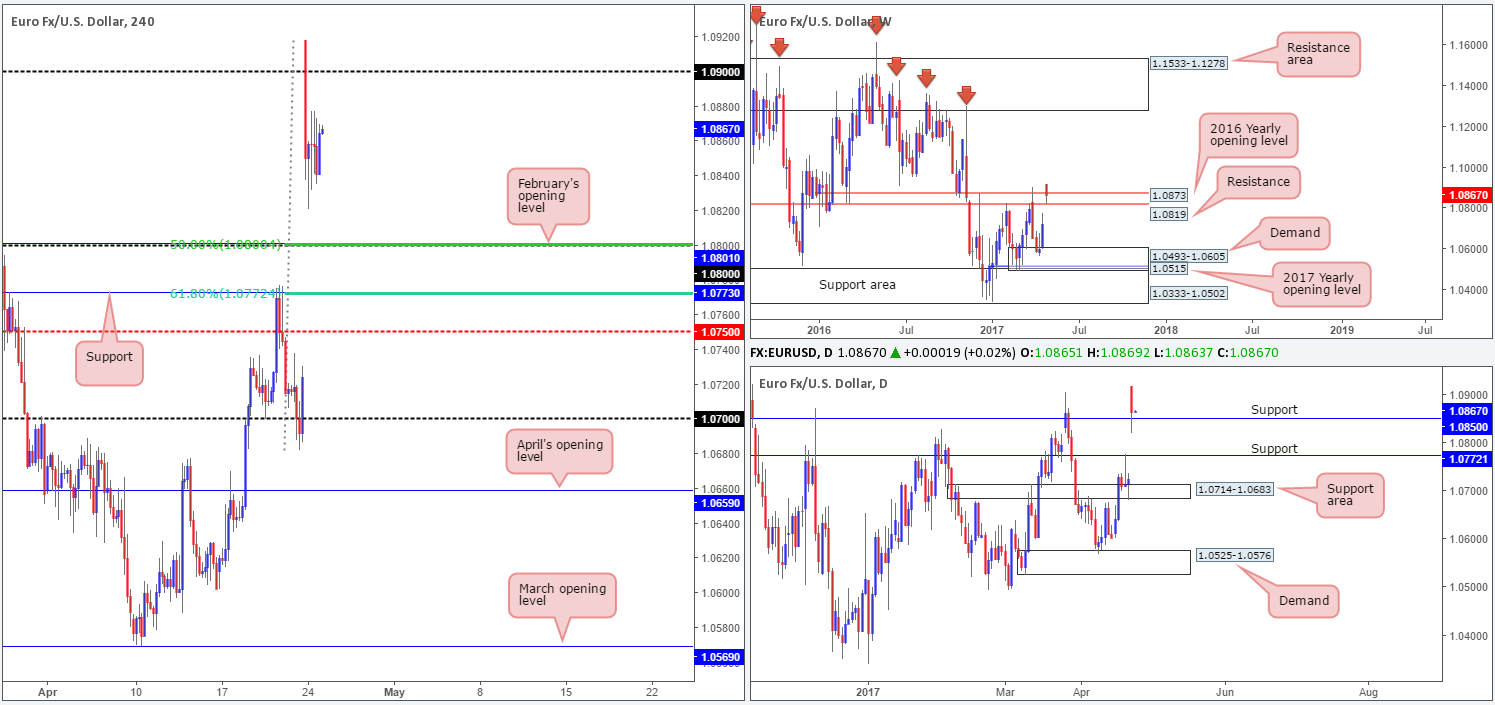
The EUR, as you can see, gapped 200 pips north at the open after a win by centrist Emmanuel Macron at the French presidential elections on Sunday. Despite this, H4 price very quickly entered into a phase of consolidation between 1.0877/1.0831.
Over on the daily timeframe, we can see that the major recently found support at 1.0850. Should the bulls continue to defend this line, the next area of resistance can be seen at 1.0971. Up on the weekly timeframe, the open forced price above resistance at 1.0819 and the 2016 yearly opening level at 1.0873, but is now seen trading back below the monthly level. We think the best thing to do on this timeframe is simply wait until the weekly candle closes before presuming that either resistance has been consumed.
Our suggestions: On the H4 chart, levels of interest this morning are as follows:
- The 1.08 handle, owing to it converging closely with February’s opening level at 1.0801 and a 50.0% retracement.
- The H4 support at 1.0773. Not only does this barrier converge with a 61.8% Fib retracement level at 1.0772, it also fuses with daily support coming in at 1.0772.
To be on the safe side here, we would strongly advise waiting for additional confirmation before attempting to enter long from either of the said levels. Ultimately, a nice-looking H4 bull candle (preferably a full-bodied close) would be ideal here!
Data points to consider: US CB consumer confidence, along with new home sales at 3pm GMT+1.
Levels to watch/live orders:
- Buys: 1.08 region ([waiting for a reasonably sized H4 bull candle to form before pulling the trigger is advised] stop loss: ideally beyond the candle’s tail). 1.0773 area ([waiting for a reasonably sized H4 bull candle to form before pulling the trigger is advised] stop loss: ideally beyond the candle’s tail).
- Sells: Flat (stop loss: N/A).
GBP/USD:
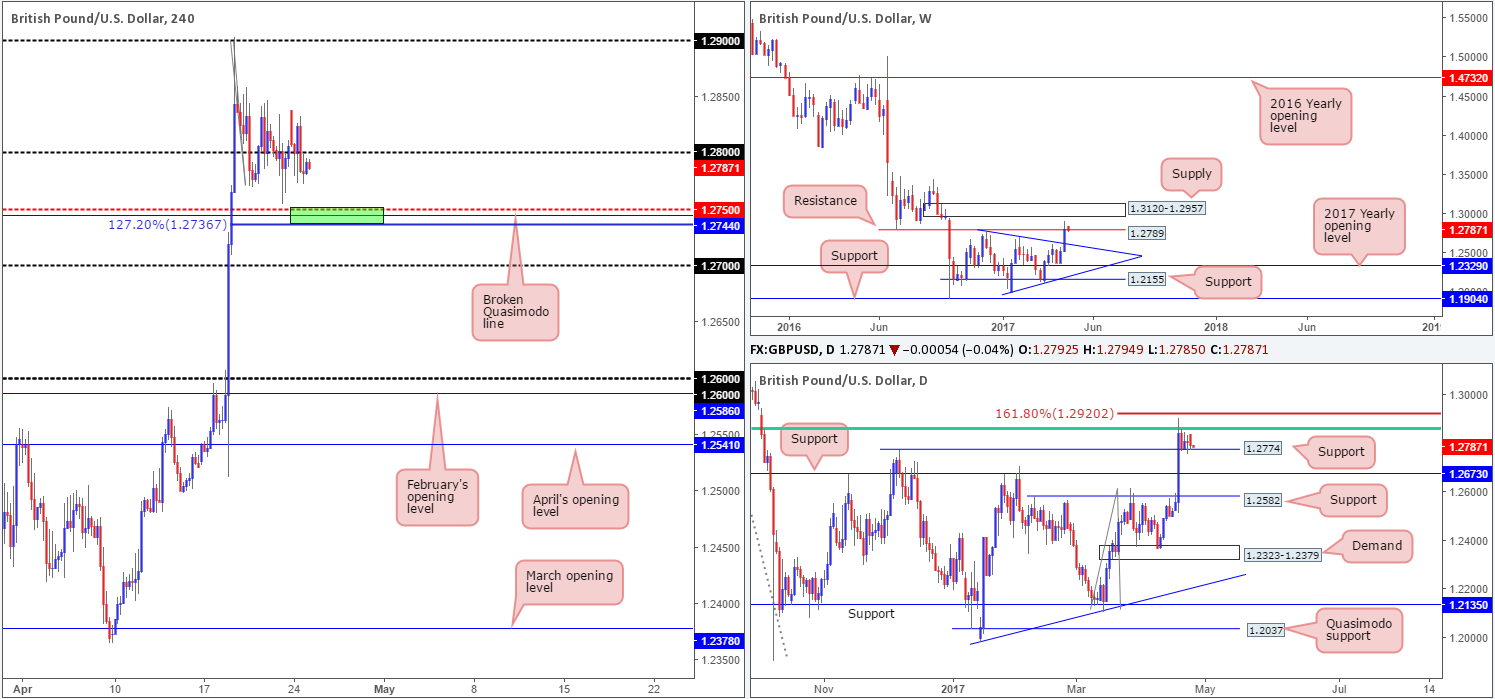
Cable, as can be seen from the H4 chart, continued to seesaw around the 1.28 handle during Monday’s sessions. Although the pair lost some ground yesterday, the overall structure of this market remains unchanged. Therefore, the crosshairs are still fixed on 1.2750 (green area) for an intraday bounce north today. Why here? Well, not only are mid-level numbers watched by the majority of the market, there’s also a AB=CD 127.2% Fib extension seen nearby at 1.2736 (drawn from the high 1.29) that unites closely with a broken Quasimodo line pegged at 1.2744.
Our rationale behind looking for a bounce off 1.2736/1.2750, apart from the H4 confluence, is also the fact that this zone is planted directly beneath daily support at 1.2774. For that reason, it could perhaps be a nice base to help facilitate a fakeout! The only grumble, of course, is that weekly sellers could still be active from resistance at 1.2789, hence the reason for not expecting much more than an intraday bounce from the H4 area.
Our suggestions: Depending on the time of day, a long from 1.2736/1.2750 looks to be stable enough to consider trading without the need for additional confirmation. Remember though, we do not expect to see much more than a small bounce from this area!
Data points to consider: US CB consumer confidence, along with new home sales at 3pm GMT+1.
Levels to watch/live orders:
- Buys: 1.2736/1.2750 (stop loss: at least five pips beyond the lower edge of the area).
- Sells: Flat (stop loss: N/A).
AUD/USD:
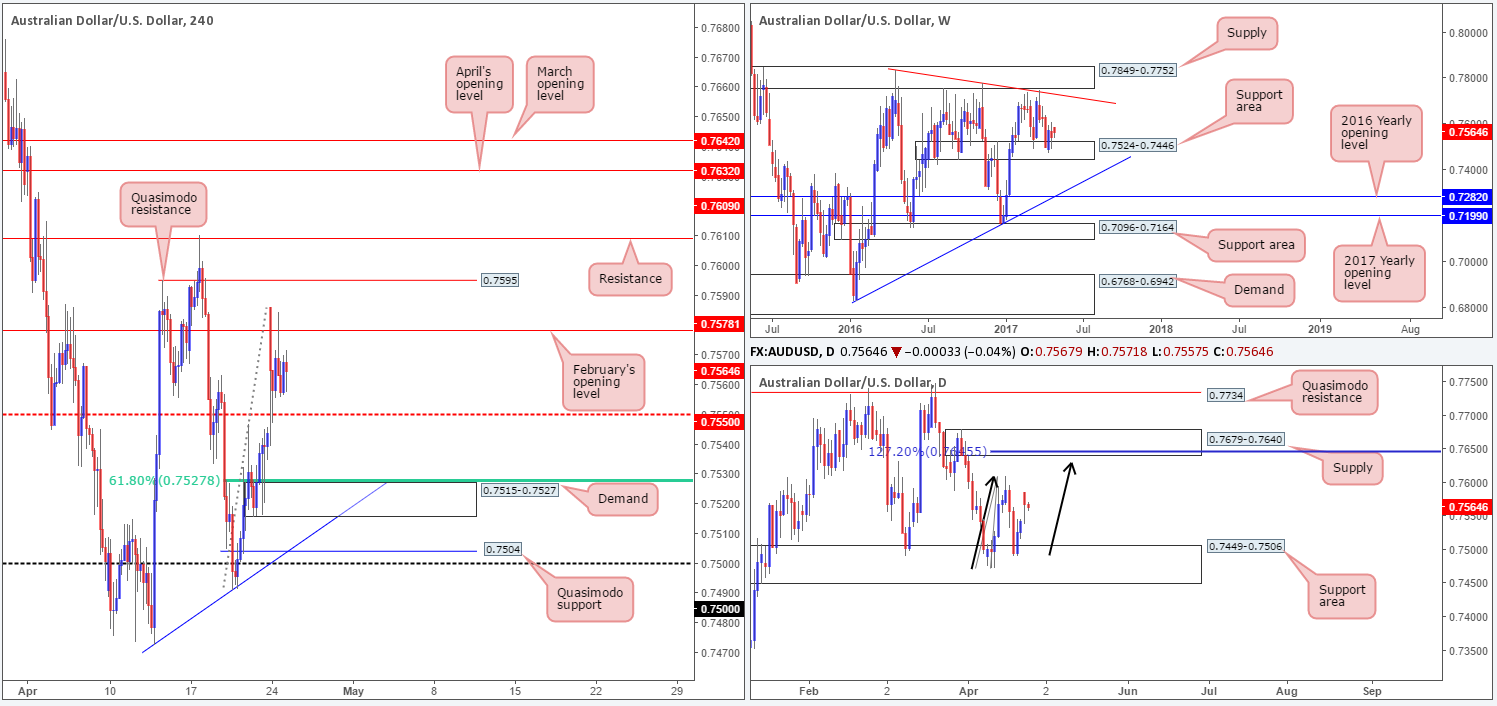
The Aussie started the day at 0.7586, gapping around fifty pips higher than Friday’s closing point. The gap, as you can see though, was quickly filled with price then seen entering into a phase of consolidation between February’s opening level at 0.7578 and the H4 mid-level support 0.7550.
Although weekly bulls have so far failed to generate anything noteworthy out of the support area marked at 0.7524-0.7446, it’s far too early to tell whether the bears are gaining the upper hand, in our opinion. Down on the daily chart, it’s possible that the candles are in the process of forming an AB=CD pattern (black arrows), which, as seen by the AB=CD 127.2% Fib ext. at 0.7645, ties in beautifully with supply at 0.7679-0.7640. For that reason, the bulls may still have a hand in this fight.
Our suggestions: Before the buyers come into play, nevertheless, we may see H4 price pullback and test demand at 0.7515-0.7527, which would imply a break of the mid-level support at 0.7550. The reasoning for selecting the said demand, apart from the higher-timeframe direction (see above), is the 61.8% Fib convergence seen at 0.7527 (taken from the low 0.7491). What would make this zone even better would be a solid approach in the form of an AB=CD formation or a three-drive pattern.
Data points to consider: US CB consumer confidence, along with new home sales at 3pm GMT+1.
Levels to watch/live orders:
- Buys: 0.7515-0.7527 ([waiting for a reasonably sized H4 bull candle to form before pulling the trigger is advised] stop loss: ideally beyond the candle’s tail or the demand).
- Sells: Flat (stop loss: N/A).
USD/JPY:
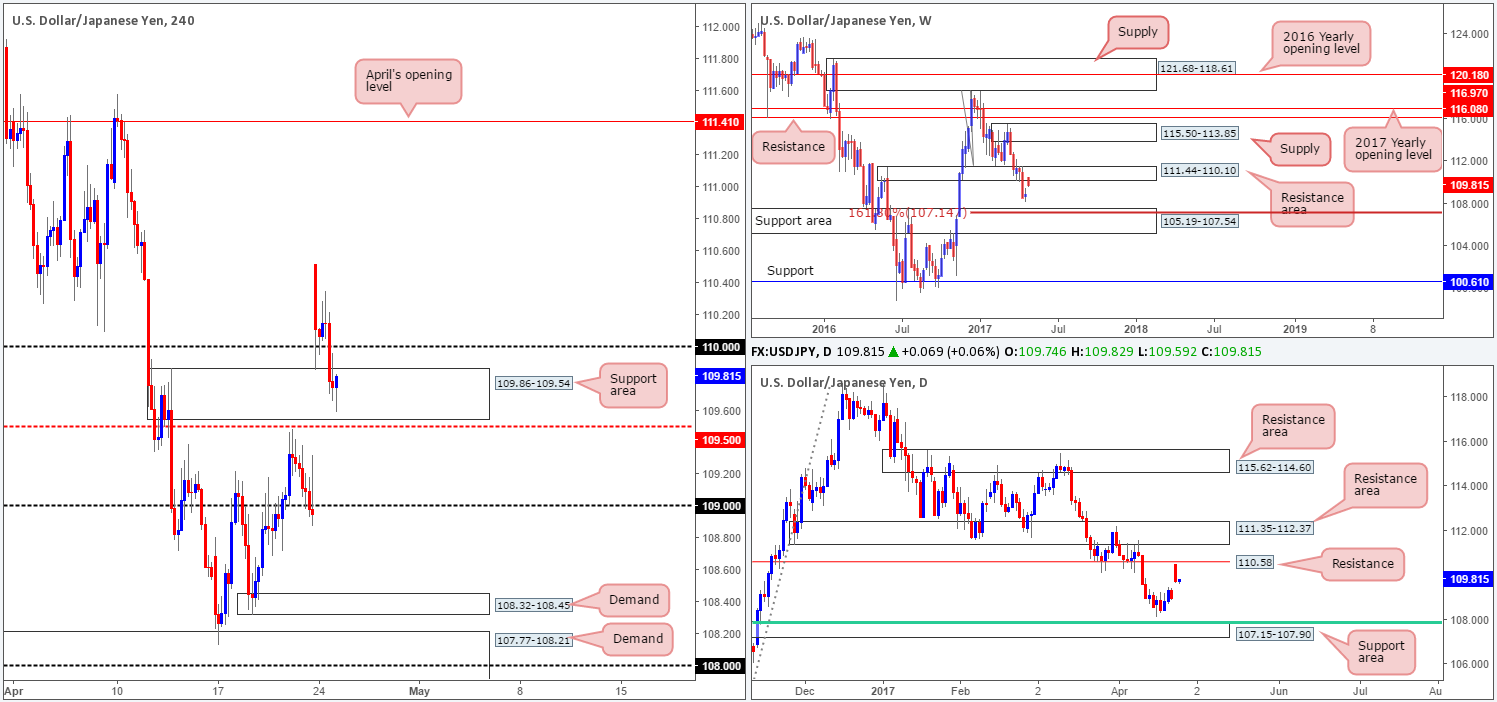
Having seen the USD/JPY aggressively gap over 150 pips north on Monday after a win by centrist Emmanuel Macron at the French presidential elections, the market then went on to retreat and gave back 50% of this move. Seeing price break back below the 110 handle and test the H4 support area seen at 109.86-109.54 has likely interested some buyers. Longs from this region, however, could be risky though. Weekly price has recently shook hands with a resistance area fixed at 111.44-110.10, and daily action came within a cat’s whisker of clipping the underside of resistance at 110.58. Therefore, we fail to see the bulls sustaining gains beyond the nearby 110 handle today.
Our suggestions: Based on the above points, technicals suggest further downside could be on the cards. And for that reason we’re looking for a H4 close to be seen beyond 109.50. This – coupled within a retest to the underside of this line and a lower-timeframe sell signal (see the top of this report) would be enough evidence to sell, targeting the 109 handle as an initial take-profit target.
Data points to consider: US CB consumer confidence, along with new home sales at 3pm GMT+1.
Levels to watch/live orders:
- Buys: Flat (stop loss: N/A).
- Sells: Watch for H4 price to engulf 109.50 and then look to trade any retest seen thereafter ([waiting for a lower-timeframe sell signal to form following the retest is advised] stop loss: dependent on where one confirms this level).
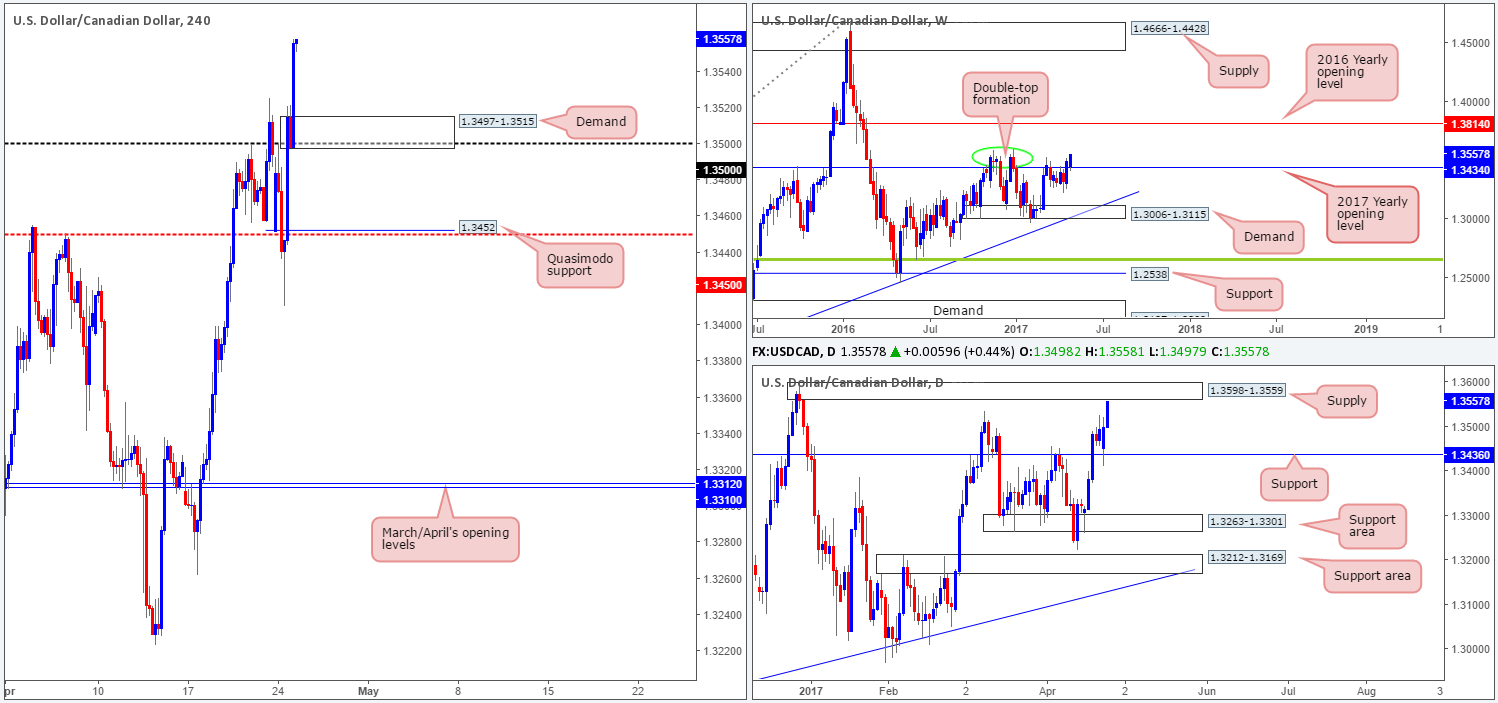
USD/CAD:
Following a retest of daily support at 1.3436, the daily candles are now seen within striking distance of supply coming in at 1.3598-1.3559. Also of particular interest is weekly flow. Despite the bulls looking in fine form at the moment, there’s a well-defined double-top formation seen around the 1.3588 neighborhood (green circle). Therefore, the bears clearly still have a hand in this game!
The recent advance also saw H4 price clear the 1.35 handle, which has consequently placed price within shouting distance of a Quasimodo resistance formed back on the 28th December 2016 at 1.3580. This line – coupled with both weekly and daily structure, has a high probability of working out. However, we must point out that there’s a psychological band sitting just above it at 1.36, so there’s a chance a fakeout may occur.
Our suggestions: To help avoid the possibility of getting stopped on a fakeout, we would simply advise waiting for a H4 bearish candle to form (preferably a full-bodied candle) before committing to a trade.
Data points to consider: US CB consumer confidence, along with new home sales at 3pm GMT+1.
Levels to watch/live orders:
- Buys: Flat (stop loss: N/A).
- Sells: 1.3580 region ([waiting for a reasonably sized H4 bear candle to form before pulling the trigger is advised] stop loss: ideally beyond the candle’s wick).
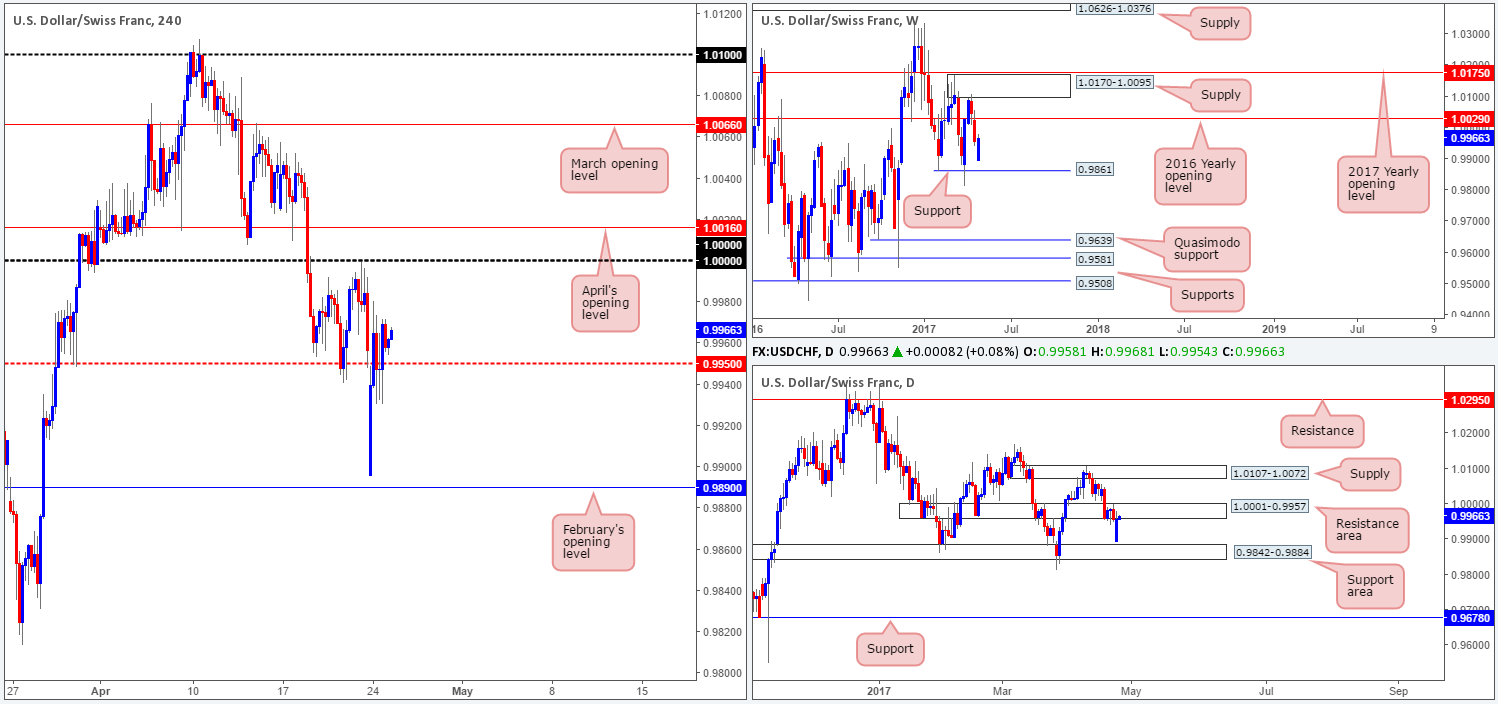
USD/CHF:
Monday began with a 60-pip gap south, which came within reaching distance of February’s opening level at 0.9890. As you can see, H4 price quickly made work of the opening gap and then entered into a tight consolidation around the mid-level support 0.9950.
With 0.9950 continuing to hold firm for the time being, will we see parity (1.0000) or even April’s opening level at 1.0016 brought into the picture today? Of course, it’s a possibility, but the daily resistance area at 1.0001-0.9957 seen in play is concerning.
Our suggestions: Personally, we have absolutely no interest in looking for longs today. Should price manage to reach parity/April’s opening level, nevertheless, a short from between these two lines is something we would be attracted to given the daily resistance area. What would interest us even more, of course, would be a reasonably sized H4 bear candle forming out of this H4 zone (preferably a full-bodied candle), essentially providing us with added confirmation.
Data points to consider: US CB consumer confidence, along with new home sales at 3pm GMT+1.
Levels to watch/live orders:
- Buys: Flat (stop loss: N/A).
- Sells: 1.0016/1.0000 ([waiting for a reasonably sized H4 bear candle to form before pulling the trigger is advised] stop loss: ideally beyond the candle’s wick).
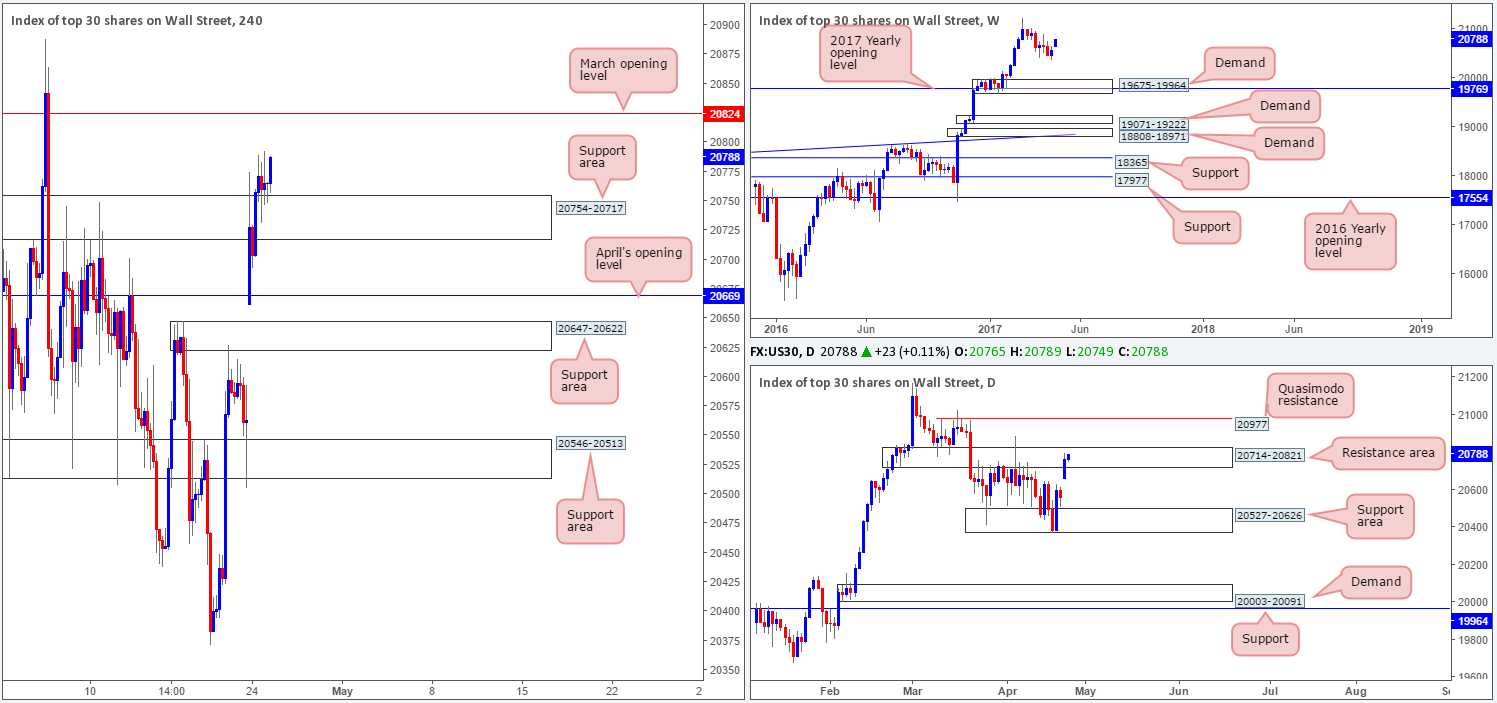
DOW 30:
US equities gapped 100 points north on Monday, which eventually lifted the index above the H4 resistance area at 20754-20717. Given that the bulls seem to be establishing support on the retest of this zone, will we see March’s opening base line at 20824 brought into view? It’s certainly a possibility, but not really something we’d be interested in buying in to. The reason being is simply because the daily candles are seen trading within the walls of a resistance area coming in at 20714-20821. Therefore, instead of looking for long plays, we’re more inclined to consider shorting March’s opening level seeing as it sits just three points above the said daily resistance area.
Our suggestions: While a short from 20824 is likely to produce a bounce, it might be worth noting that weekly action could potentially break to fresh highs in the near future. As such, to sell 20824, we would strongly recommend waiting for a lower-timeframe confirming signal to take shape before committing (see the top of this report).
Data points to consider: US CB consumer confidence, along with new home sales at 3pm GMT+1.
Levels to watch/live orders:
- Buys: Flat (stop loss: N/A).
- Sells: 20824 region ([waiting for a lower-timeframe sell signal to form is advised] stop loss: dependent on where one confirms this level).
GOLD:
After a somewhat hostile beginning to the week, the yellow metal seems to have found refuge around a H4 support area coming in at 1266.0-1270.7. This area, as you can probably see, houses a weekly support level at 1263.7 and also sits just on top of a daily support zone drawn from 1265.2-1252.1. In view of this, we ultimately expect the gold market to advance this week, at least filling the weekend gap and maybe touching base with H4 supply at 1292.5-1289.2.
Our suggestions: Quite simply, what we’re looking for H4 price to achieve today is a retest of the current support area. Should this occur, we’ll then be looking for a reasonably sized H4 bullish rotation candle (preferably full-bodied) to take shape. Only then would our team look to buy this market, with hopes of riding bullion up to at least the close of the weekend gap around the 1283.4ish range.
Levels to watch/live orders:
- Buys: 1266.0-1270.7 ([waiting for a reasonably sized H4 bull candle to form before pulling the trigger is advised] stop loss: ideally beyond the candle’s tail or the support area).
- Sells: Flat (stop loss: N/A).
