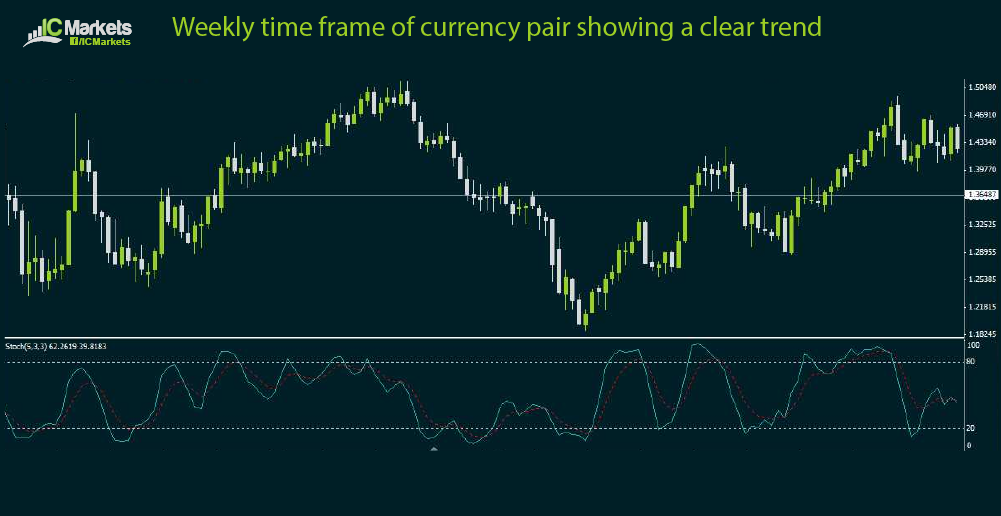
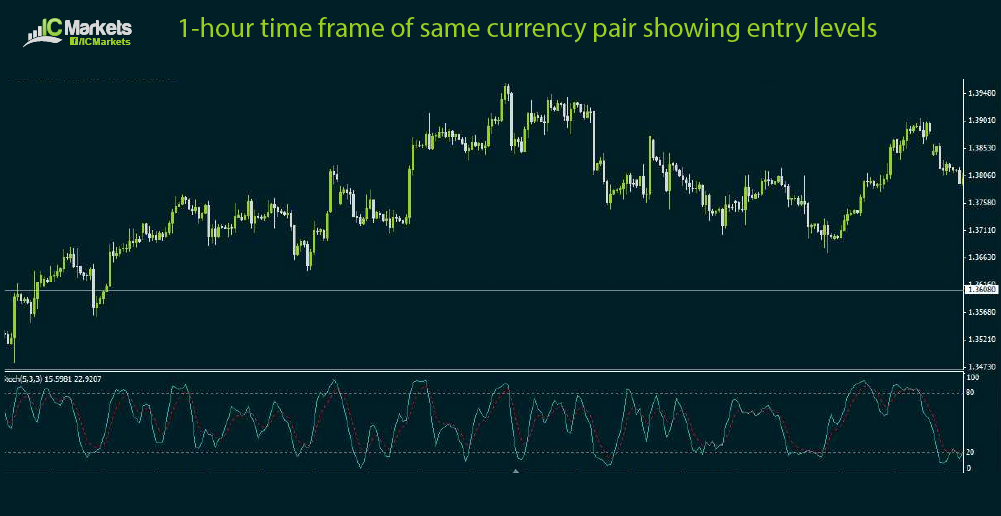
While using a combination of technical indicators can help confirm price movements and filter out false signals, most traders opt to conduct multiple time frame analysis for additional confirmation. This method simply involves looking at the same currency pair across various time frames, from the short term 15-minute to the long-term daily or weekly charts. The reason behind this approach is that some trends are more visible on longer-term time frames. Meanwhile, some reversal signals or potential entry levels might be clearer on shorter-term time frames. With that, it helps to have both a bird’s eye view of price action then to zoom in to determine exact entry or exit levels for a trade.
In this example, the daily time frame of the currency pair is showing a very clear trend but it can be difficult to determine precise entry points for a long trade simply based on this chart.
Zooming in to the 1-hour time frame of the same currency pair can be helpful in pinpointing possible Fibonacci retracement levels or breakouts of nearby inflection points, which would confirm that the ongoing trend will continue. There are no definite rules that state which time frames you should look at, as you have to determine this based on your trading style or what works for you. If you are a swing trader, you might be more comfortable looking at the daily chart and the 4-hour chart. If you’re a scalp trader, you might want to watch the 1-hour chart then zoom in to the 15-minute time frame. Some traders find price action longer-term time frames too slow and they’d rather take quick moves with tight stops based on short-term time frames. Other traders are not too comfortable about fast price movements on minute charts so they’d rather trade the long-term charts and hold on to their trades for days or weeks. Of course there are a few advantages and disadvantages to favoring certain time frames. For instance, the advantage of sticking to longer-term charts is that it allows the trader to maintain his bias without having to check intraday charts every now and then. The disadvantage, however, is that this approach generates fewer trade signals. On the other hand, the advantage of looking at shorter-term time frames is that the trader is able to spot several trade opportunities very often. However, transaction costs for these trades could pile up and eat part of the profits. This also requires the trader to be flexible and able to change biases quickly. Another factor to consider, apart from one’s trading style, when it comes to deciding which time frames to trade is capital. Trading shorter-term charts usually requires lower margin while longer-term trades may require a bigger account to avoid getting a margin call.


