This section further illustrates how the Fibonacci retracement and extension levels tend to have a higher probability of holding when they coincide with other types of support and resistance.
For instance, a price breakout tends to pull back to the broken support or resistance level as a retest. A downside break from a key support area, particularly in a longer-term time frame, tends to be followed by a retracement to that same level before price resumes its drop.
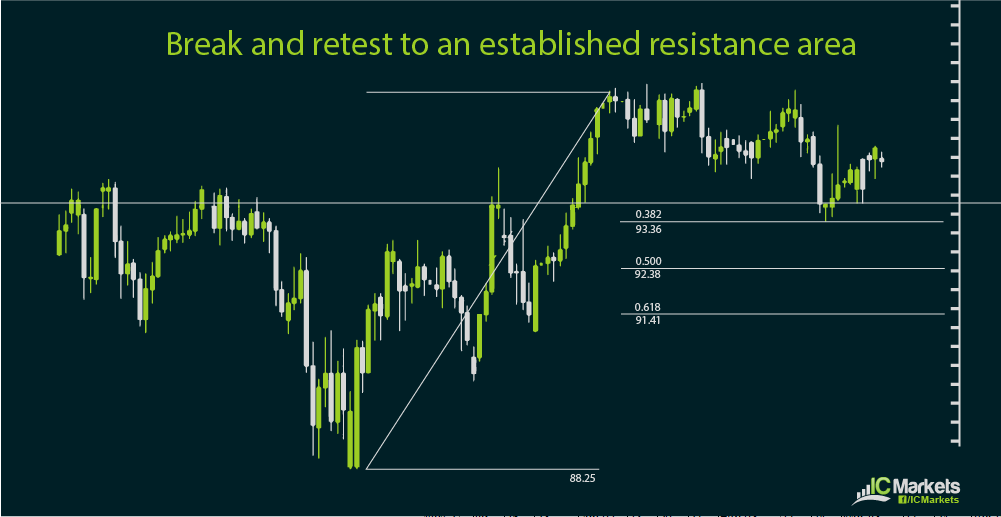
Similarly, an upside break from an established resistance area is usually followed by a pullback to that same level before price resumes its climb. Using the swing low to the swing high or the peak of the upside breakout should generate potential entry levels, and the one that is closest to the broken resistance area could have plenty of buy orders located.
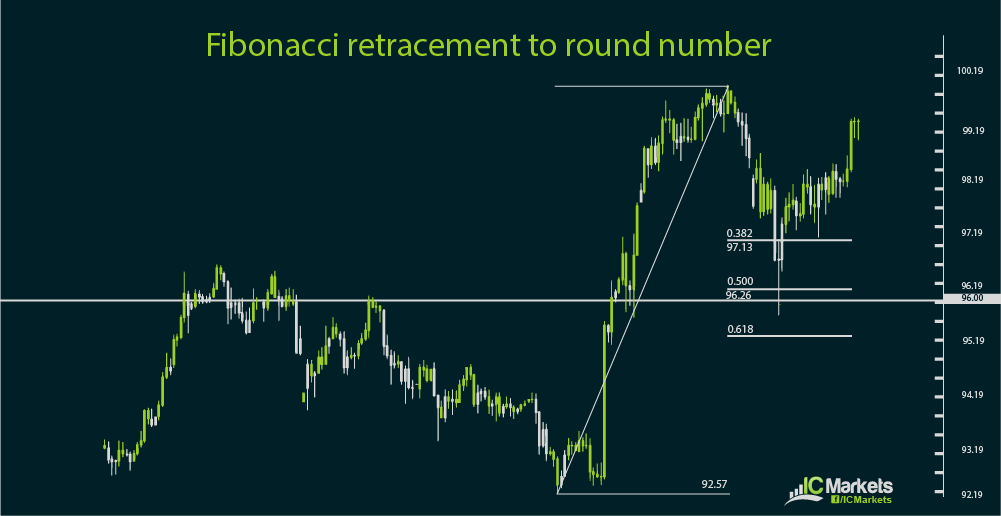
Another way to select which Fibonacci retracement level to place an order on is the one closest to a major or minor psychological level. Since these round numbers tend to be respected best by yen pairs, this method typically works on those.
The reason why this combination of Fibonacci levels with support or resistance works as an entry method is that plenty of traders already have their eyes locked on those levels. As such, they tend to have a self-fulfilling property in that the sheer number of buy or sell orders located in those levels are enough to make it hold and trigger a bounce.
The same principle applies for selecting profit targets with Fibonacci extension levels. Potential levels could be those located at established support or resistance levels, those nearby major or minor psychological levels, or pivot points.
In the event that you are having trouble choosing among the potential Fibonacci retracement levels to set your entry order on, you might want to consider the scaling in method. This involves setting several entry orders on multiple levels, with the trade entry price being the average of those levels.
Remember that it’s not absolutely necessary to get the best possible entry price. What matters is that you did your homework, tried to come up with a high-probability setup, selected a potential entry point, and have a strategy to manage your risk properly.
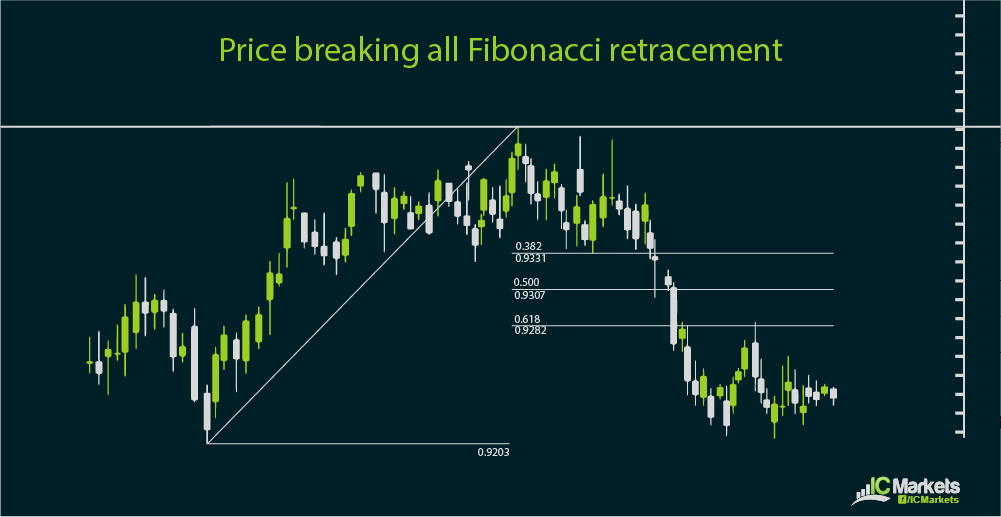
Of course, nothing is set in stone in the forex market, and even the best technical analysis combining Fibonacci levels with support or resistance still has the chance of failing. This can happen when there is a sudden shift in market sentiment or an unforeseen event.
In this case, it could be a sign of a market turn and the start of a new trend. Before shifting sides, traders often zoom in to shorter-term time frames to see if there are opportunities to hop in smaller retracements.
Fibonacci retracement for intraday trading can also be used in conjunction with the previous day high, low, open, or close as these can also act as intraday inflection points.


