Key risk events today:
US ADP Non-Farm Employment Change; Canada Trade Balance; US ISM Services PMI.
(Previous analysis as well as outside sources – italics).
EUR/USD:
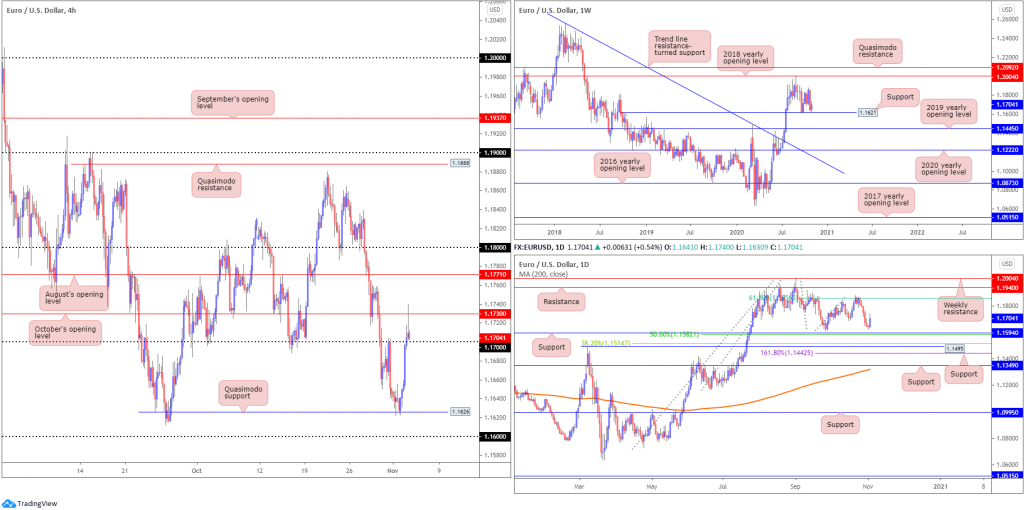
The euro rose sharply on Tuesday, capitalising on the dollar’s downbeat tone amidst a robust pick-up in risk.
Technical traders will acknowledge H4 Quasimodo support at 1.1626 stood its ground, with weekly price also coming within a few pips of testing support at 1.1621. H4, as you can see, elbowed through orders at 1.17 to shake hands with October’s opening value at 1.1730. Note also the reaction spurred a shooting star candlestick pattern, generally interpreted as a bearish signal at peaks.
Should H4 sellers overlook 1.1730 and the bearish candlestick formation, August’s opening value at 1.1771 is in the offing.
Crossing over to the daily timeframe, we can see price found demand north of support at 1.1594 and nearby 50.0% retracement ratio at 1.1582, with further buying to potentially reach for the 61.8% Fibonacci retracement ratio at 1.1856.
Areas of consideration:
- The H4 shooting star candle pattern off October’s opening value at 1.1730 is in a vulnerable position, technically speaking, largely due to price recently rebounding just north of weekly support at 1.1621 and the trend, seen clearly on the weekly and daily timeframes, pointing to the upside. Therefore, we may see bullish themes emerge off the 1.17 handle today, in favour of a 1.1730 break to target 1.1771.
GBP/USD:
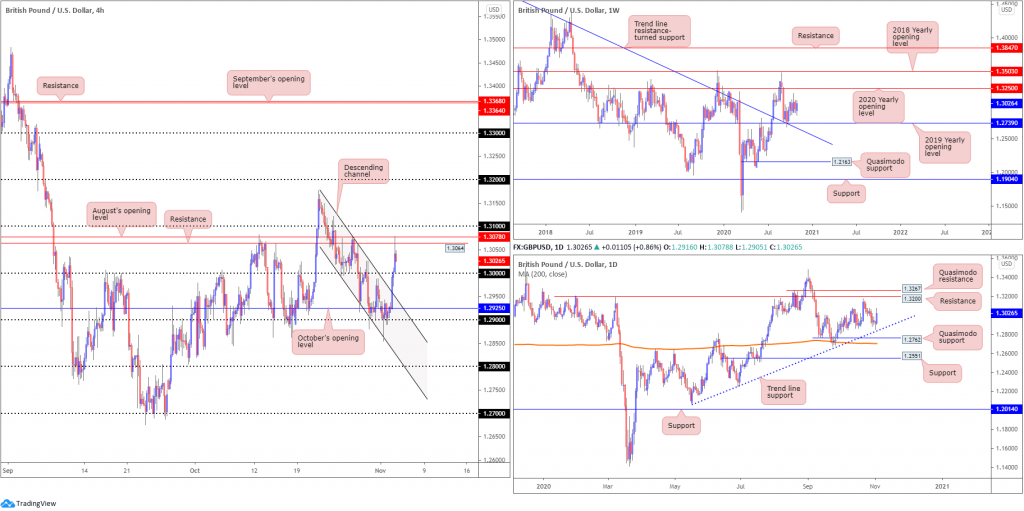
Sterling pencilled in a strong performance against a broadly softer buck on Tuesday, with cable, off the 1.29 handle on the H4, slicing through a number of key technical resistances, including the 1.30 handle. Resistance, in recent hours, emerged at 1.3078-1.3064 (August’s opening value and a resistance level), an area sheltered under the 1.31 handle.
Further out on the higher timeframes, weekly price could pop either way with resistance seen at the 2020 yearly opening value from 1.3250, and support coming in from 1.2739, a 2019 yearly opening value that blends closely with trend line resistance-turned support, extended from the high 1.5930. It is also worth pointing out the aforementioned trend line was engulfed in July of this year, announcing an uptrend could be on the cards. From the daily timeframe, after coming within touching distance of trend line support, extended from the low 1.2075, price is seen fast approaching resistance at 1.3200.
Areas of consideration:
- Room to stretch higher is visible on the higher timeframes, targeting 1.3200/50.
- The above suggests an acceleration through 1.31 on the H4. Bullish scenarios setting up north of the round number has the 1.32 handle in sight, which as we already know represents a daily resistance base.
AUD/USD:
The US dollar voyaged to lower levels on Tuesday amidst a risk-on narrative, leading to healthy AUD demand.
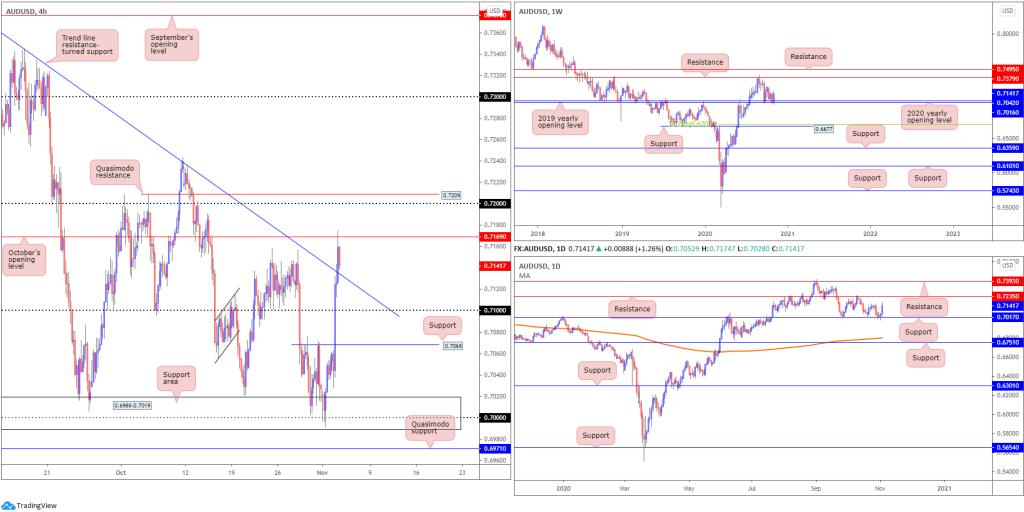
H4 ran through trend line resistance, taken from the high 0.7413, and crossed swords with resistance at 0.7169 (October’s opening value). Continued buying today has the 0.72 handle to target, followed by Quasimodo resistance at 0.7209. With 0.7169 responding well as resistance, the recently engulfed trend line resistance could now serve as support.
The 2020 (0.7016) and 2019 (0.7042) yearly opening values continue to be recognised as support on the weekly timeframe, with current price having engulfed prior losses. Resistance at 0.7379 lines up as the next upside hurdle. It should also be pointed out that the trend in this market remains to the upside.
In partnership with weekly supports, support on the daily timeframe recently made an appearance at 0.7017. This week’s reaction has potentially reignited interest at resistance from 0.7235.
Areas of consideration:
- The selling off 0.7169 on the H4 timeframe is likely to be interpreted as a bout of profit taking. Though with H4 trend line resistance now taken, and the higher timeframes driving off supports, a retest at the recently engulfed trend line resistance (as support) may come to fruition today and attract fresh buying.
- The area between 0.7235 (daily resistance) and 0.72 on the H4 is a zone longs are likely to have on the watchlist as a take-profit base. In addition, sellers may also be eyeballing the area as a potential reversal zone.
USD/JPY:
The US dollar modestly edged lower against the Japanese yen on Tuesday, as risk-on movement weighed on the safe-haven buck.
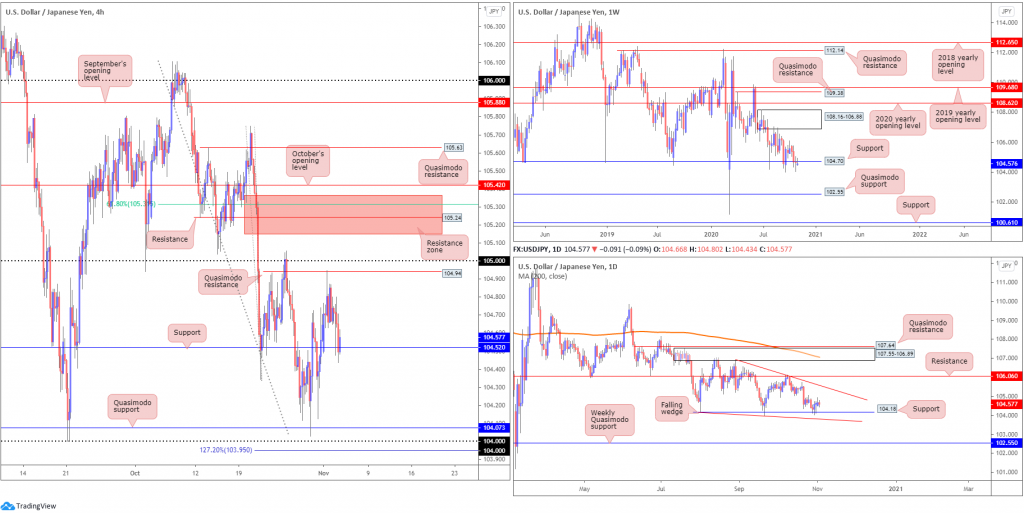
Technically, the reaction from H4 Quasimodo resistance from 104.94 (sited just south of the 105 handle) eventually guided H4 candles back to support at 104.52, which, as you can see, is offering a floor right now. Should buyers fail to hold 104.52, monitoring H4 Quasimodo support at 104.07 and the 104 handle could be an idea. It is also worth reminding ourselves of the resistance area between 105.36-105.14 (red), which represents an attractive base (technically speaking) that holds a number of key levels within and benefits from any buy-stop liquidity above the 105 handle.
Long-term support from 104.70 remains under pressure on the weekly timeframe. The lack of buying pressure seen September onwards has been less than impressive, suggesting the support is fragile. Quasimodo support at 102.55 offers a feasible target beyond current support, while a 104.70 rejection places supply back in the mix at 108.16-106.88.
Movement on the daily timeframe is visibly compressing between two converging descending lines taken from 104.18/106.94, establishing a falling wedge pattern. Due to the series of lower lows and lower highs since March, the current falling wedge is likely to be interpreted as a reversal signal should a breakout higher take shape. What’s also interesting from a technical perspective is the pair is rebounding from daily support coming in at 104.18.
Areas of consideration:
- On the one hand we have weekly price threatening moves lower south of support at 104.70; on the other hand, though, daily price is holding above its support at 104.18.
- A H4 bullish candlestick forming off H4 support at 104.52 may lure buying today, ultimately taking aim at the H4 resistance area between 105.36-105.14 (red) seen beyond 105. Though should H4 close sub 104.52 today this could indicate weekly sellers are gathering steam under support at 104.70, with H4 traders perhaps targeting the 104 neighbourhood.
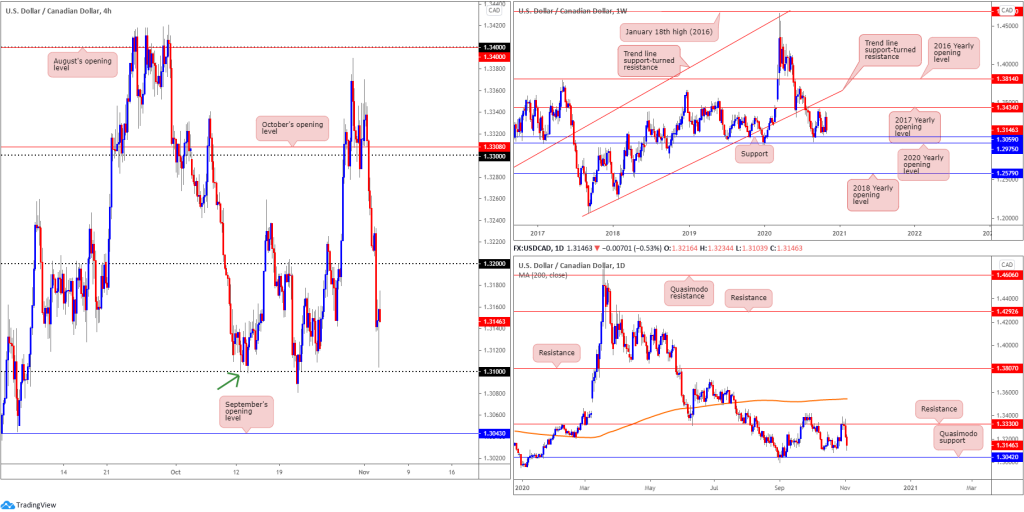
USD/CAD:
Crude oil extended recovery gains Tuesday, underpinning demand for the Canadian dollar. This, in conjunction with a strong USD decline, sent USD/CAD steamrolling through the 1.32 handle to one-week lows just north of the 1.31 handle and established a H4 hammer candlestick pattern. Traders may also acknowledge that the 1.31 handle represents a H4 Quasimodo support (green arrow).
The technical landscape on the weekly timeframe has candle action fluctuating between gains/losses amid weekly support priced in at 1.3059 and the 2017 yearly opening value at 1.3434. The story on the daily timeframe, nevertheless, continues to navigate territory south of resistance at 1.3330, with follow-through to potentially target Quasimodo support at 1.3042.
Areas of consideration:
- The 1.31 handle on the H4 is interesting support, aided by H4 Quasimodo support.
- September’s opening value at 1.3043 on the H4 scale, in the event we overthrow 1.31, could be a support worth observing having seen the level merge closely with daily Quasimodo support at 1.3042.
USD/CHF:
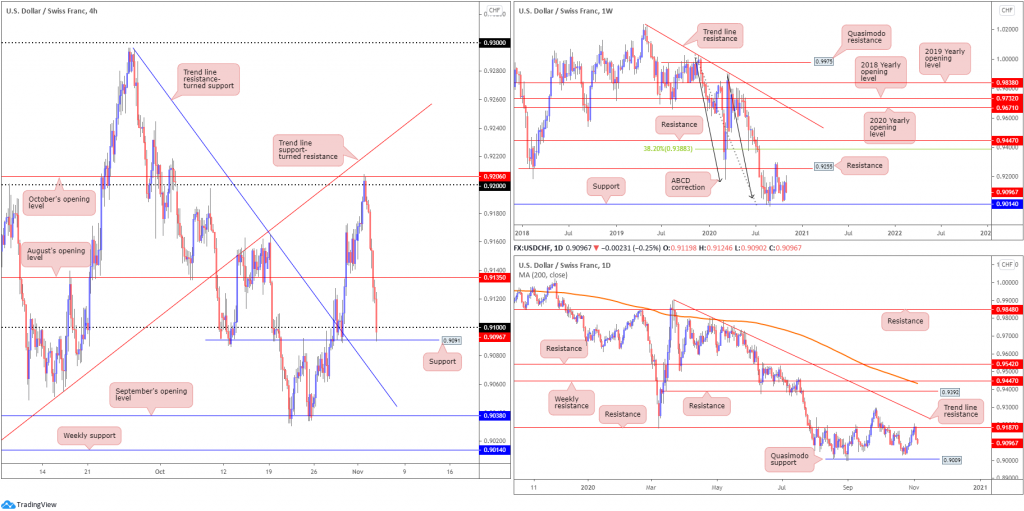
Firmly snapping a six-day bullish phase, USD/CHF tumbled 0.8% on Tuesday, following Monday’s 0.92 rejection on the H4. After swinging under August’s opening value at 0.9135, early Asia on Wednesday probed orders at the 0.91 level to test H4 support at 0.9091. It should be noted that continuation selling targets trend line resistance-turned support, taken from the high 0.9295, followed by September’s opening value at 0.9038.
On the higher timeframes, we can see daily price fading resistance at 0.9187, with additional weakness eyeing Quasimodo support at 0.9009. On the weekly timeframe, we see resistance plotted at 0.9255, a previous Quasimodo support level, as well as support coming in at 0.9014 (essentially merging with the aforementioned daily Quasimodo support).
Areas of consideration:
- Tapping sell-stop liquidity beneath 0.91 and drawing in fresh buyers off H4 support at 0.9091 could lead to an intraday push for higher levels today. With higher timeframes lacking support, however, the advance could be short-lived. Consequently, a H4 close under 0.9091 may be seen, potentially unlocking bearish scenarios to 0.9038 on the H4.
Dow Jones Industrial Average:
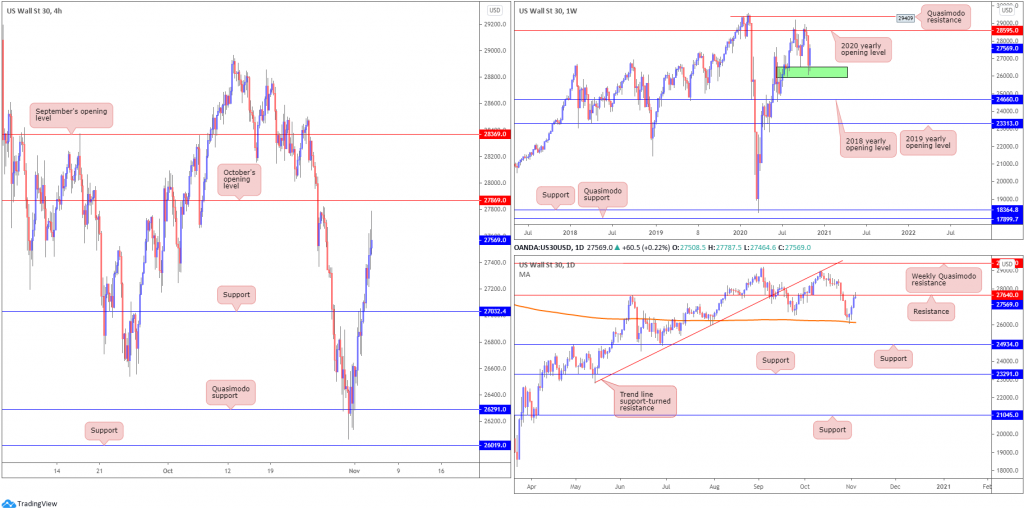
Major US equity indexes finish Tuesday higher across the board as US Elections get underway. The Dow Jones Industrial Average advanced 554.98 points, or 2.06%, the S&P 500 climbed 58.92 points, or 1.78% and the Nasdaq traded higher by 202.96 points, or 1.85%.
From the weekly timeframe, demand at (green) 25916-26523 is serving buyers well. Should further buying materialise, the 2020 yearly opening value at 28595 is seen. Alongside the weekly demand area, Friday’s rebound from the 200-day SMA (orange – 26140) on the daily timeframe has seen follow-through gains develop to test resistance at 27640.
H4 sailed above resistance at 27032 (now potential support) on Tuesday, with price, in early Asia Wednesday, nearing October’s opening value at 27869. A breach here could deliver another wave of buying towards September’s opening value at 28369.
Areas of consideration:
- The combination of daily resistance at 27640 and October’s opening value at 27869 could hamper upside attempts today, though with weekly buyers coming off demand the possibility of buying is, of course, certainly still there.
- Breaking 27869 signals buyers may take things to September’s opening value at 28369, followed by weekly resistance at 28595.
XAU/USD (GOLD):
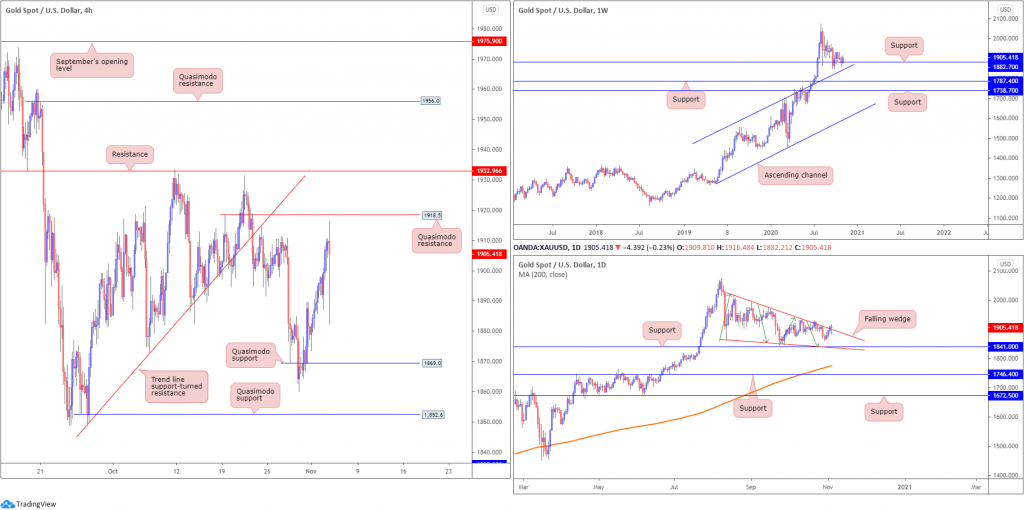
Kicking off from the weekly timeframe, we can see price remains buoyed off support at $1,882, sited just north of channel resistance-turned support, taken from the high $1,703. Should a wave of buying emerge, long-term traders’ crosshairs are likely focussed on the all-time peak $2,075.
The daily timeframe has been in the process of creating a falling wedge pattern between $2,015 and $1,862 since mid-August (the lower boundary also lines up closely with support at $1,841). Given the recent close above the upper boundary and the trend in this market having been decisively higher since 2016 (although price has been trending higher much longer than this overall), this may be interpreted as a bullish continuation signal.
Levels to watch on the H4 chart are the Quasimodo resistance around $1,918 and Quasimodo support at $1,869. A break higher could target resistance at $1,932, while beneath $1,869, another Quasimodo support is seen at $1,852.
Areas of consideration:
- Long term, the breakout above the daily falling wedge could spark bullish moves off weekly support ($1,882).
- The above may push forward a H4 close above Quasimodo resistance at around $1,918, igniting intraday bullish breakout strategies in favour of at least H4 resistance from $1,932.
The accuracy, completeness and timeliness of the information contained on this site cannot be guaranteed. IC Markets does not warranty, guarantee or make any representations, or assume any liability regarding financial results based on the use of the information in the site.
News, views, opinions, recommendations and other information obtained from sources outside of www.icmarkets.com.au, used in this site are believed to be reliable, but we cannot guarantee their accuracy or completeness. All such information is subject to change at any time without notice. IC Markets assumes no responsibility for the content of any linked site.
The fact that such links may exist does not indicate approval or endorsement of any material contained on any linked site. IC Markets is not liable for any harm caused by the transmission, through accessing the services or information on this site, of a computer virus, or other computer code or programming device that might be used to access, delete, damage, disable, disrupt or otherwise impede in any manner, the operation of the site or of any user’s software, hardware, data or property
